


Table of Contents
Key takeaways
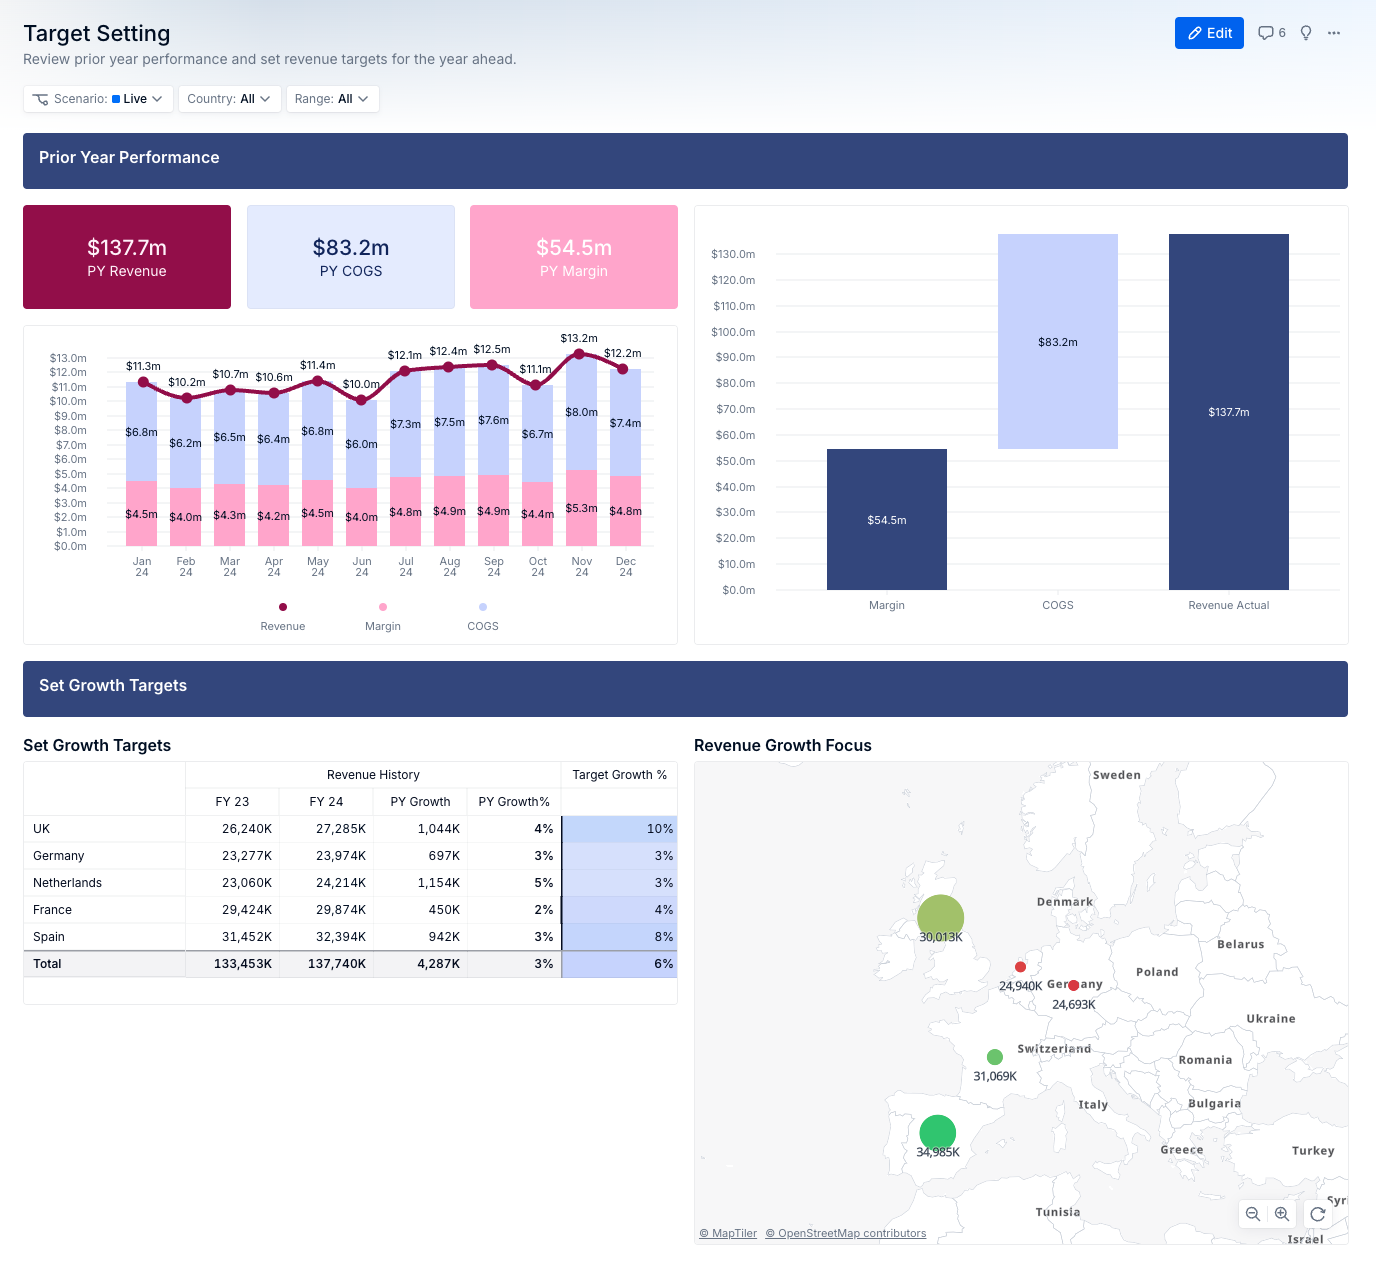
- Pigment AI generates revenue charts and relevant insights from the PY Revenue KPI by product type, country, and range, enabling faster self-serve analysis.
- In the VP of Sales scenario, reviewing UK performance by quarter shows a significant jump in the most recent quarter and cuts analysis time from 2–3 hours to minutes.
- For the Country Manager, a workflow notification flags the new UK target, and natural-language analysis of Q4 2023 to Q4 2024 indicates 10% growth looks achievable.
- The Country Manager’s deeper analysis finds UK growth is heavily concentrated in a few recipes for the 65+ age group, prompting changes to Euro Classics contribution and campaign budgets.
- Three months into 2025, the finance analyst identifies a -8% UK revenue gap versus forecast and sees monthly revenue patterns that indicate a seasonal business.
- Pigment AI recommends Seasonal Differencing for the forecast, producing a baseline with upper and lower confidence levels that suggests the 10% growth target is not achievable.
- The article states Pigment AI saves meaningful time on each interaction, with example savings ranging from 2–3 hours per analysis to half or a full day for forecasting.


Before working at Pigment, I led finance teams of various shapes and sizes: which means I can completely sympathize with those that still experience month-end chaos, spreadsheet wrangling, and wasted hours trying to surface insights.
Looking back today, I’m struck by how different my job could have been, had I had access to the AI functionality present in Pigment.
The value it provides is sometimes difficult to appreciate because it can be somewhat diffuse - it offers incremental gains, every time you use the platform. And it’s helpful for every user, regardless of seniority or platform experience.
To illustrate my point, let's imagine you work at Mealbox, a fictional meal prep company that delivers convenient recipe boxes to your door.
We’re going to experience a day in the life of three different roles across the company.
VP of Sales
We’re coming towards the end of 2024, and as VP of Sales I’m looking to set targets for next year.
To help me do that, let’s do some analysis on the relative performance of different territories and countries.
I could easily do that using normal Pigment platform capabilities. But with AI, I’m able to do it even faster.
If I click the ‘Get Insights’ button on the PY Revenue KPI component, Pigment will first generate charts based on my revenue - breaking it down by product type, country, and range. Then, it’ll perform analysis to surface relevant insights it thinks I might be interested in.
It’s incredibly valuable to have this kind of analysis generated this fast. As VP of Sales I’m not necessarily the best model builder, so I’d normally need to go to an analyst for this kind of thing.
But with Pigment AI, I’m able to self-serve.
But that’s not all I can do.
These charts are fully interactive, as if you’d built them yourself in Pigment - so you’re free to change the way you view the data or publish to a Board.
I’ve heard that the UK has performed very well recently. So let’s look at revenue by country, and change the view so it’s broken down by quarter.
When I do that, I can see that yes, the UK (blue bar) has seen a significant jump in the most recent quarter.
Based on everything I’ve seen, I’m going to double our target growth figure. I do so, and tag the Country Manager for the UK to be sure it’s achievable.
Estimated time saved:
Based on my experience prior to Pigment, the process of sourcing, testing, and formatting this data would’ve taken 2-3 hours. But the analysis I’ve performed here has taken a couple of minutes.
Country manager
Let’s now switch to the Country Manager’s point of view.
We’ve got a Workflow set up that’s pushed me a notification, telling me that I need to review the new target for the UK set by the VP of Sales. These notifications are invaluable when there’s a lot going on - they keep everyone at Mealbox on track.
10% growth is a big number. But we also experienced some really impressive growth in the last quarter, so I’m going to start by doing some analysis to understand what drove it.
Let’s pull up sales growth between Q4 2023 and Q4 2024. I don’t need to do anything other than ask, in natural language.
Based on the numbers in the past year, our 10% growth target is looking very achievable. I’d like to understand more though, so I ask Pigment to dig in the data - it looks like the growth was heavily concentrated in a few recipes for the 65+ age group.
Based on this information, I’m going to adjust the contribution of the Euro Classics product range, and set up some conversations with our product and marketing teams to rebalance campaign budgets in line with these numbers.
Estimated time saved:
Another 2-3 hours of work sourcing the right data for each year, at the right level of granularity, and creating reports.
Finance analyst
Unfortunately, we’re now 3 months into 2025 and Q1 growth is looking slightly behind the forecast.
In the UK in particular, we’ve got a -8% revenue gap that’s making me nervous about the forecast for the rest of the year.
I decide I’m going to investigate further, so I quickly pull up revenue by month.
From the shape of the graph, you can see that we’re quite a seasonal business. Based on that, I decide I’m going to use machine learning to build a forecast.
I’m not a data scientist or a programmer, so I’m feeling a little unclear about doing this for the first time. For that reason, I don’t know which machine learning model to choose to perform my forecast.
Fortunately, I’m able to ask Pigment to help me out.
Digging through documentation is no longer necessary with Pigment AI: when I run into an issue or need to remember how to build a formula, I just ask.
Seems like Seasonal Differencing is the best choice in this circumstance. Let’s go ahead and run the prediction.
What I get is a baseline forecast, as well as some upper and lower confidence levels.
Unfortunately, it confirms that our 10% growth target isn’t looking achievable - I think I’m going to override our original forecast with this one.
Estimated time saved:
Creating a new high level forecast would’ve involved collating numbers, formatting data, updating and checking drivers, and more. This could have taken me anywhere between half and a whole day of work.
Summarize that for me
Every time you interact with the platform, Pigment’s AI functionality saves you meaningful time. Over the course of a week, month, or year, that compounds into some serious productivity gains.
If you’d like to learn more, book a demo today.
The functionality featured in this article is all available in Pigment today. But with the release of our AI Agents - the Analyst, the Planner, and the Modeler - you’ll be able to achieve even more.


