Table of Contents
Key takeaways
- 83% of firms are overspending on AI, with average spending coming in ~27% above expectations.
- AI confidence remains remarkably high: average ROI confidence is 8.2/10, despite widespread budget overruns.
- AI is reshaping jobs, not simply replacing them: 32% increased finance headcount because of AI, versus 20% that reduced it.
- 1 in 3 firms are already reducing hiring for roles that AI can cover, pointing to a bigger impact on future roles than existing jobs.
- Finance teams spend ~32 hours every month on executive reporting, and the most AI-mature teams actually spend more time, not less.
- The UK is bucking the trend: 70% of UK finance leaders say the change in government leadership increased their confidence, while expected revenue growth reached 13.2%.


Already, almost unbelievably, we are at the end of Q3 2026. And while we haven’t seen anything quite as seismic as we did in Q2, there has been plenty to keep CFOs up at night.
The Fed hiked rates for the first time since 2023, oil is above $100 a barrel, and the midterms are just around the corner.
The UK has its seventh prime minister since the Brexit vote, French public debt is at its highest level since 1946, and Merz’s government in Germany is in crisis.
Meanwhile, AI capex has climbed even higher, driven in large part by a switch to consumption-based pricing by major vendors like Anthropic.
So how is the global finance community reacting?
Drivers of uncertainty and response to turbulence
There's no single dominant driver of uncertainty in Q3. All 11 score between 2.76 and 2.99 on a 4-point impact scale.
Every one is rated at about "moderate impact" - CFOs aren't worried about one big thing, they’re just generally worried.
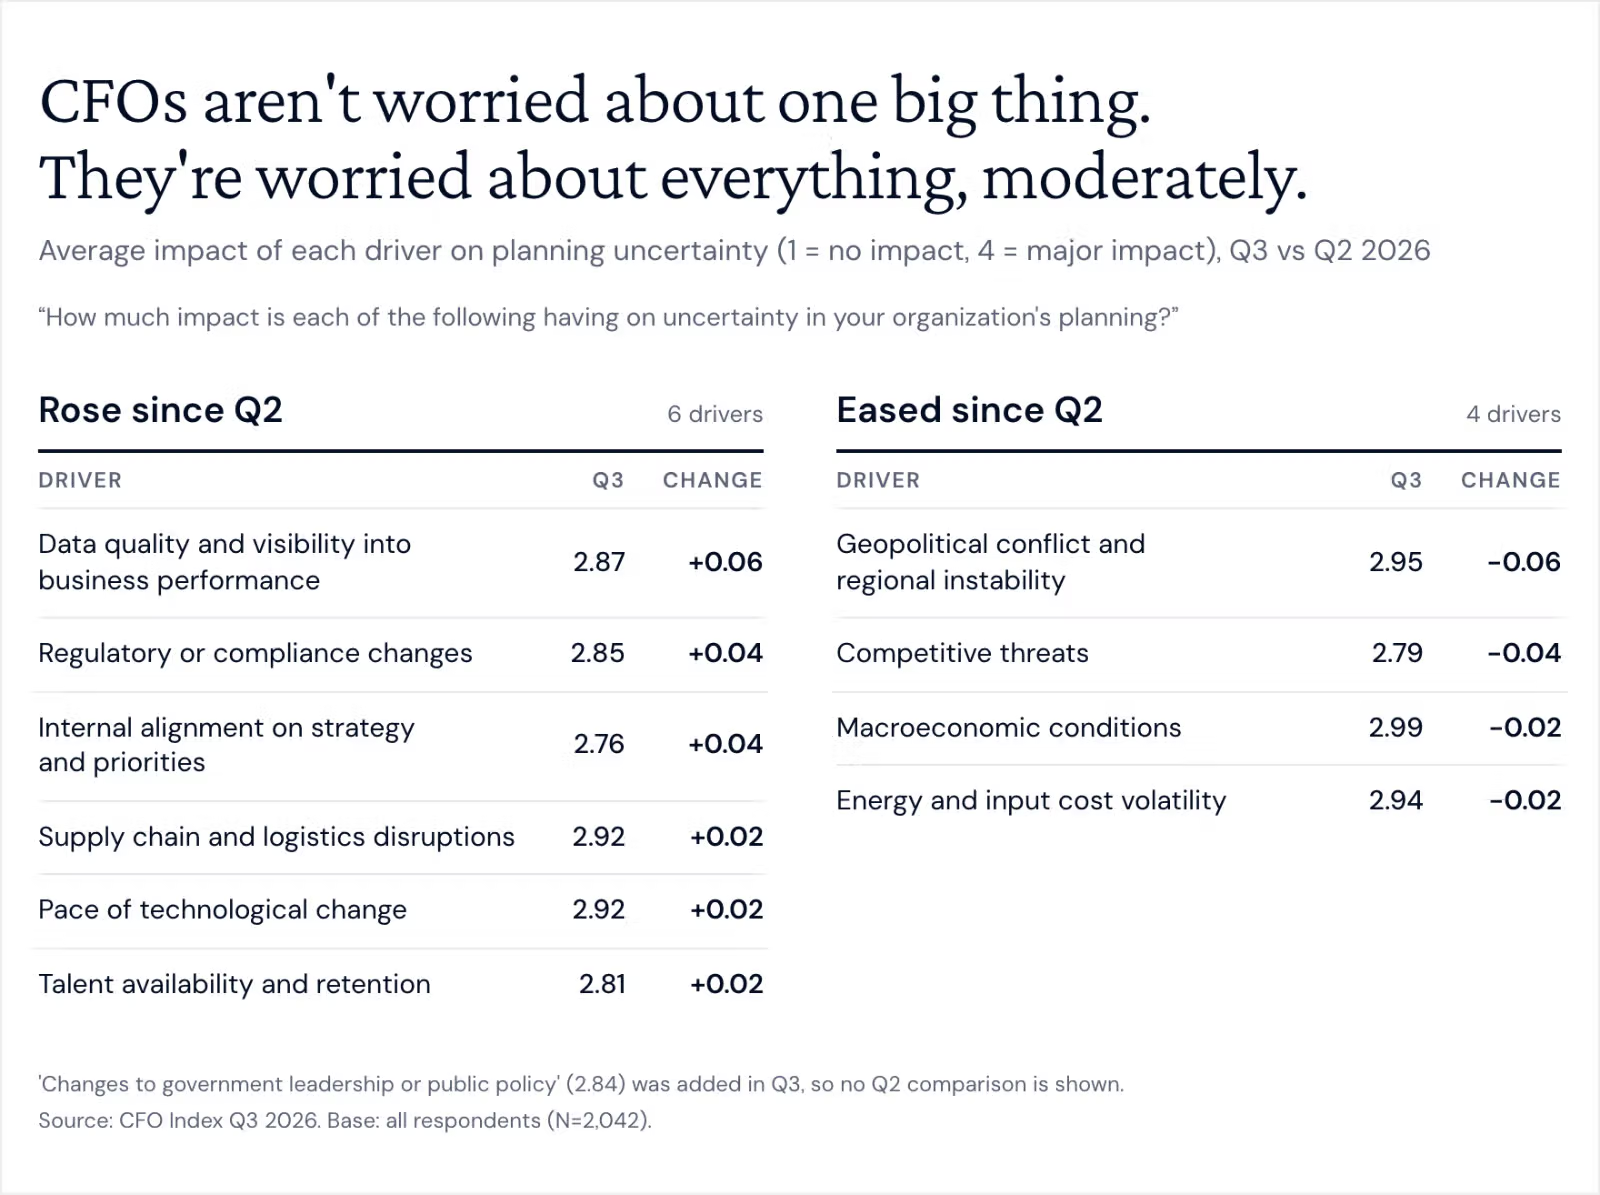
External shocks (macro, geopolitics, competition) have eased slightly, while internal pressures (data quality, strategic alignment, talent, regulation) have all increased slightly. But geopolitical conflict remains the number one driver of uncertainty globally - for obvious reasons.
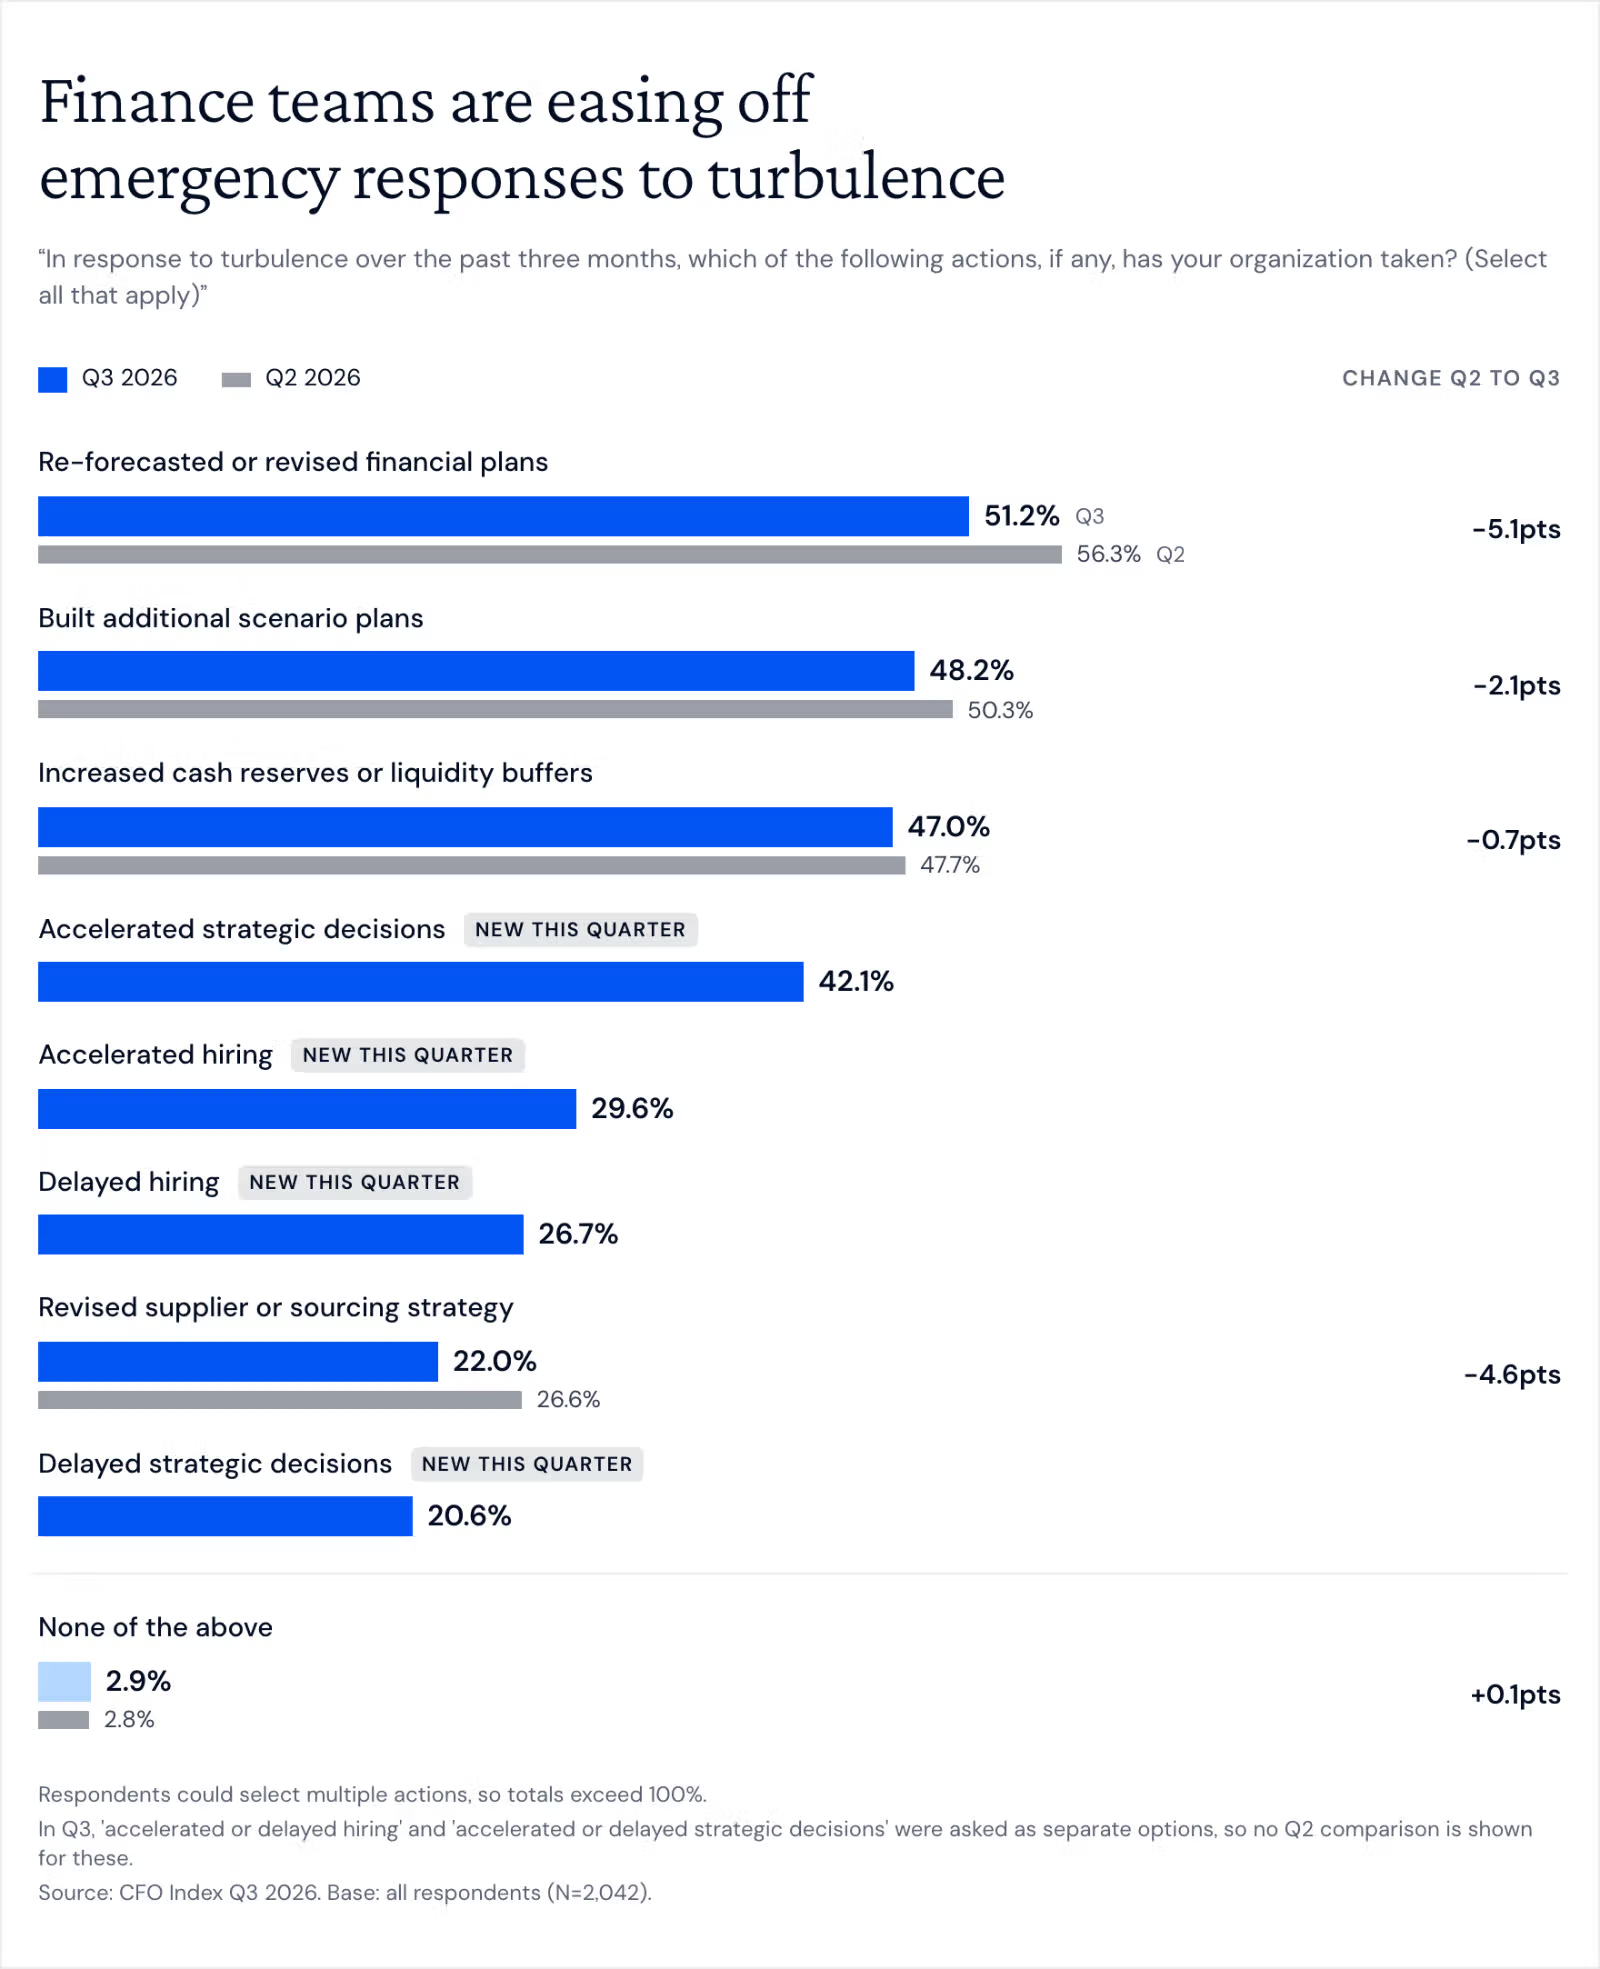
Meanwhile, we’re seeing a drop across the board in ‘emergency’ turbulence response activity: it’s been a less busy quarter for finance teams.
Interested in improving your scenario planning capabilities? We’ve got you covered - download our playbook here.
Revenue performance, expected growth, and confidence
Revenue performance in the past year, in the US and in the UK, has remained resilient even in the face of uncertainty. France and Germany meanwhile are significantly gloomier, both posting decreases from their Q2 figures.
In the growth forecasts, the UK is the only market improving, with respondents predicting 13.2% higher revenues in the year to come, up 0.41pp from Q2.
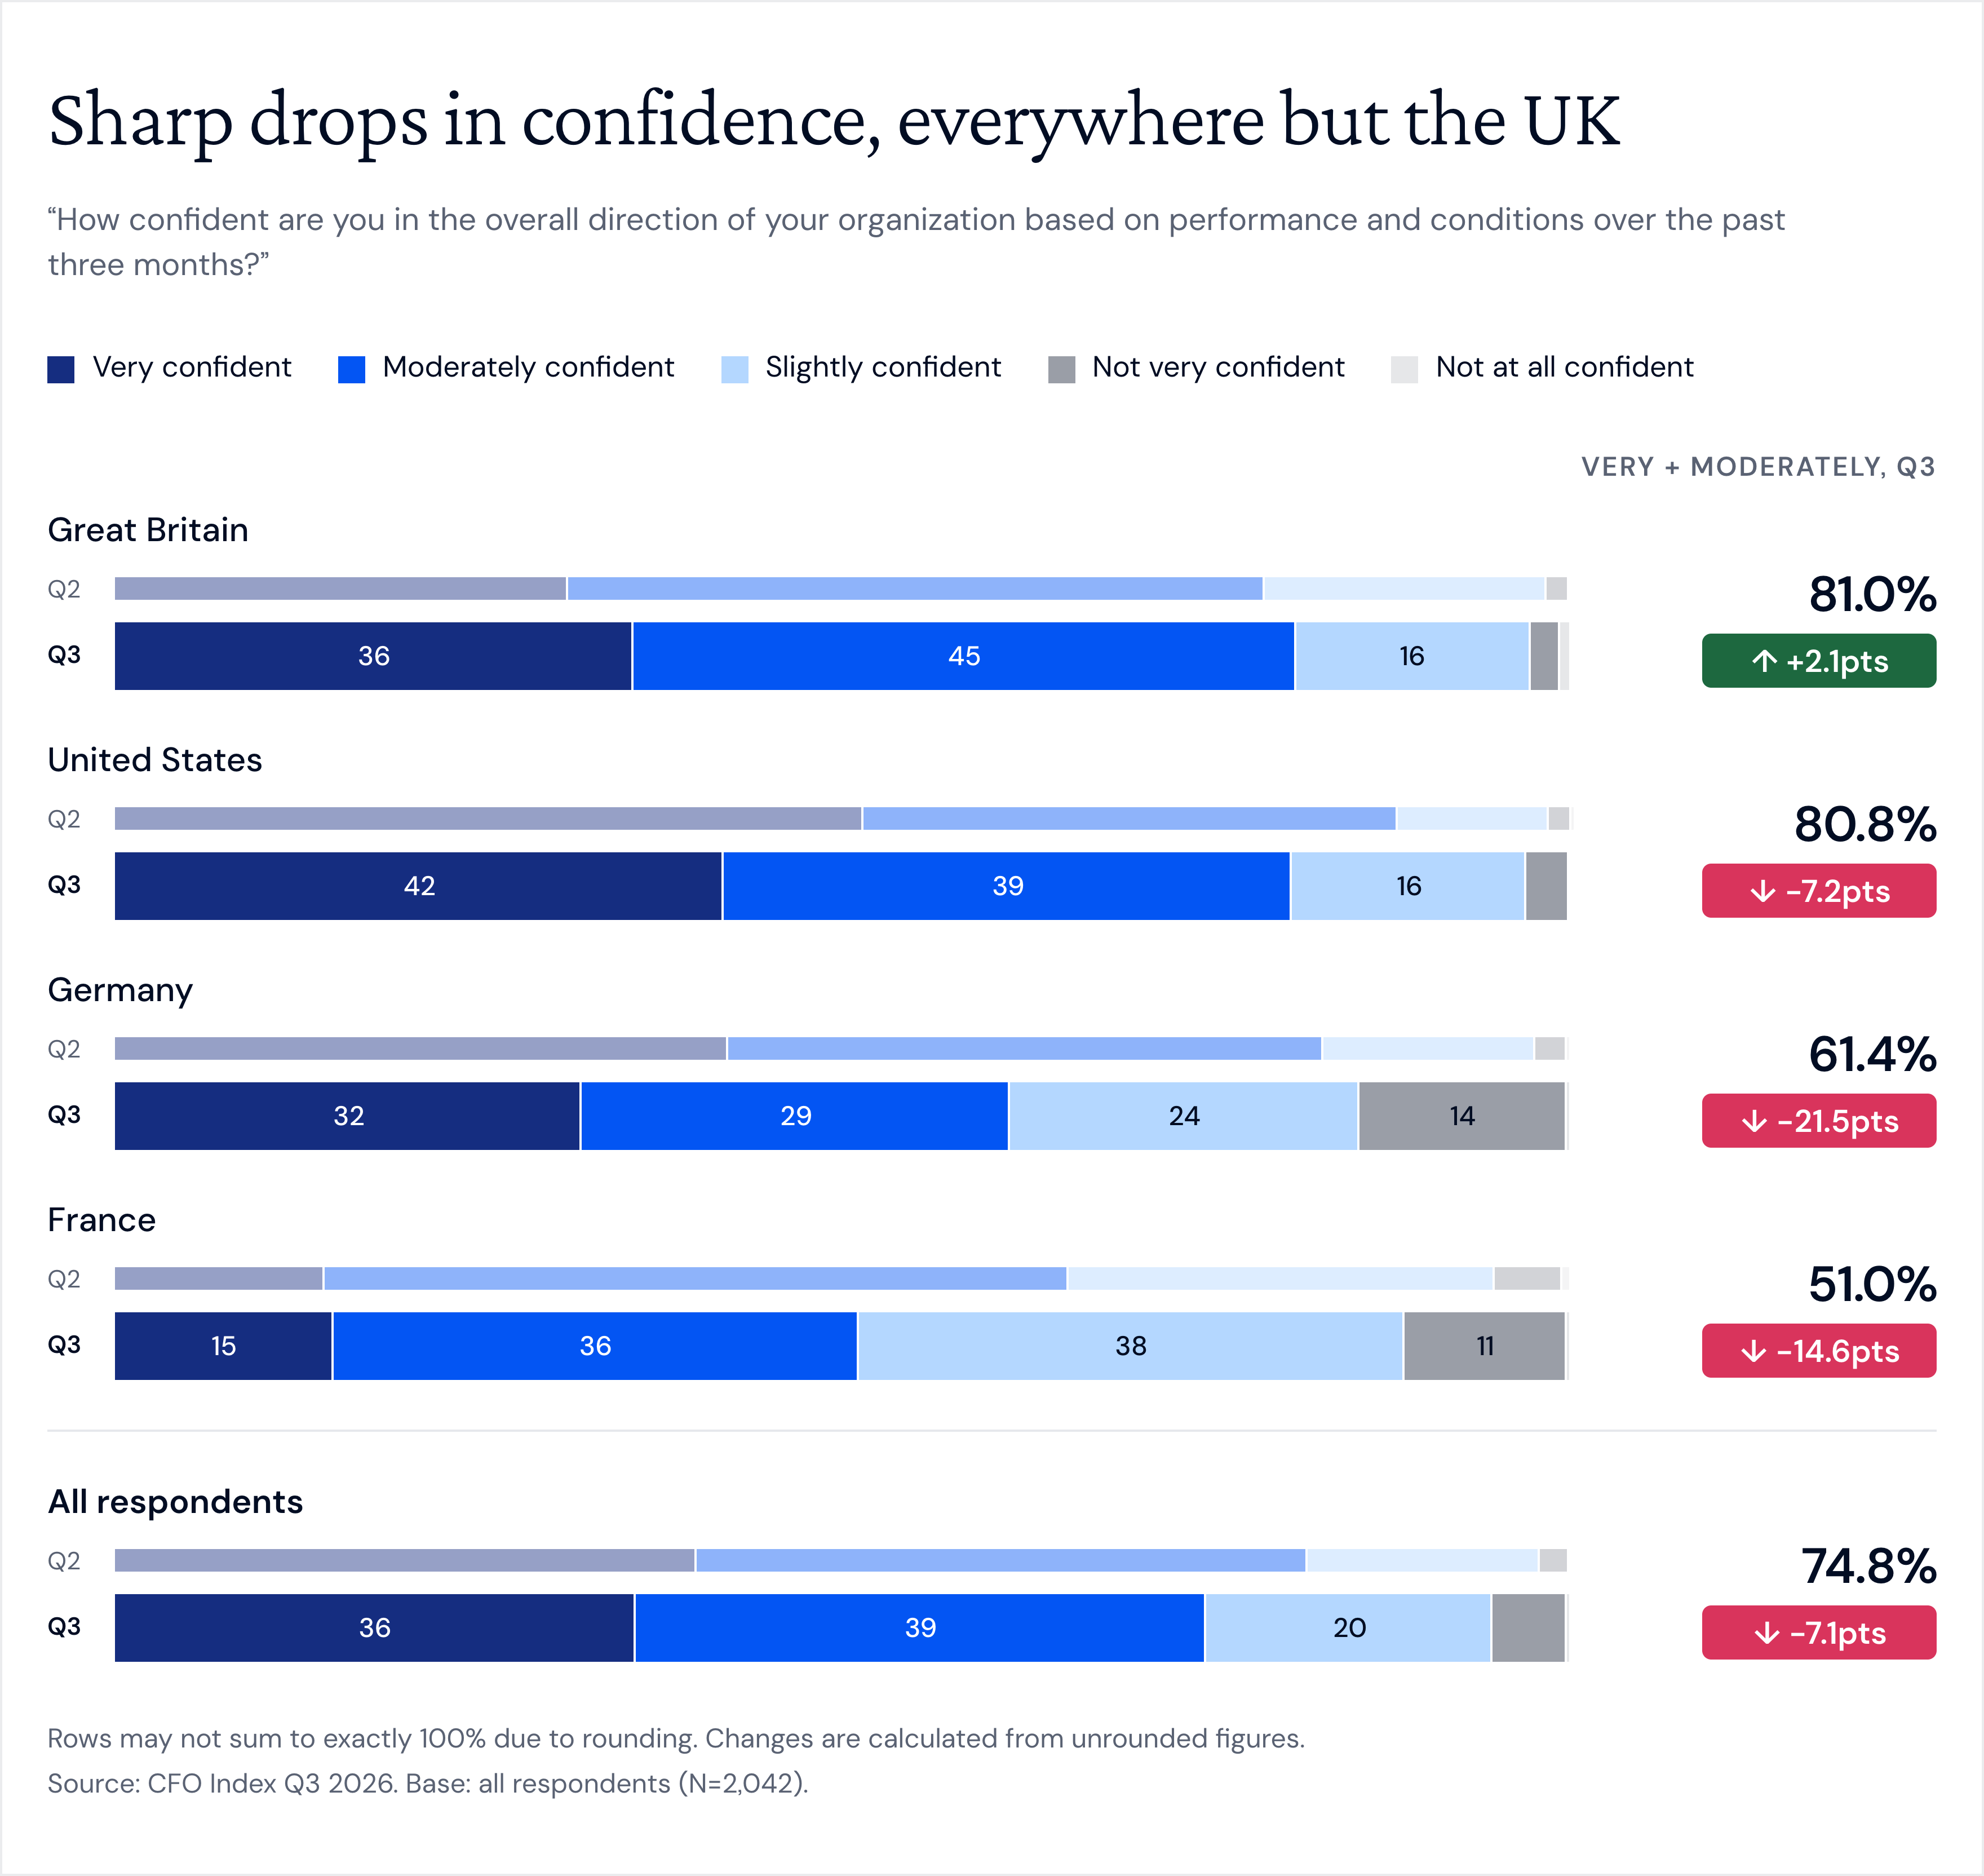
The same story plays out in the confidence figures - we've seen dramatic drops in the confidence levels (share saying they're moderately or very confident in the direction of their organization) in the US, France, and Germany.
But in the UK, that number has increased 2.1pp, which means it's now the most optimistic market.
Among VP/CFOs and directors, "very confident" fell about 9 points, while among managers it was almost unchanged (+0.8).
The people closest to the board, the cost of capital and the full P&L lost the most confidence - perhaps unsurprising in a quarter in which rates rose and growth assumptions had to be revisited.
The Burnham bounce, and the midterms loom large
It’s official: we’re seeing a ‘Burnham bounce’ in the UK.
70% said the change in the UK government leadership had directly increased their confidence (26% significantly), and only 9% said it decreased. Taken with the growth forecasts (and the fact that the UK is the only market showing an increase in planned AI investment numbers), the situation there is looking comparatively rosy.
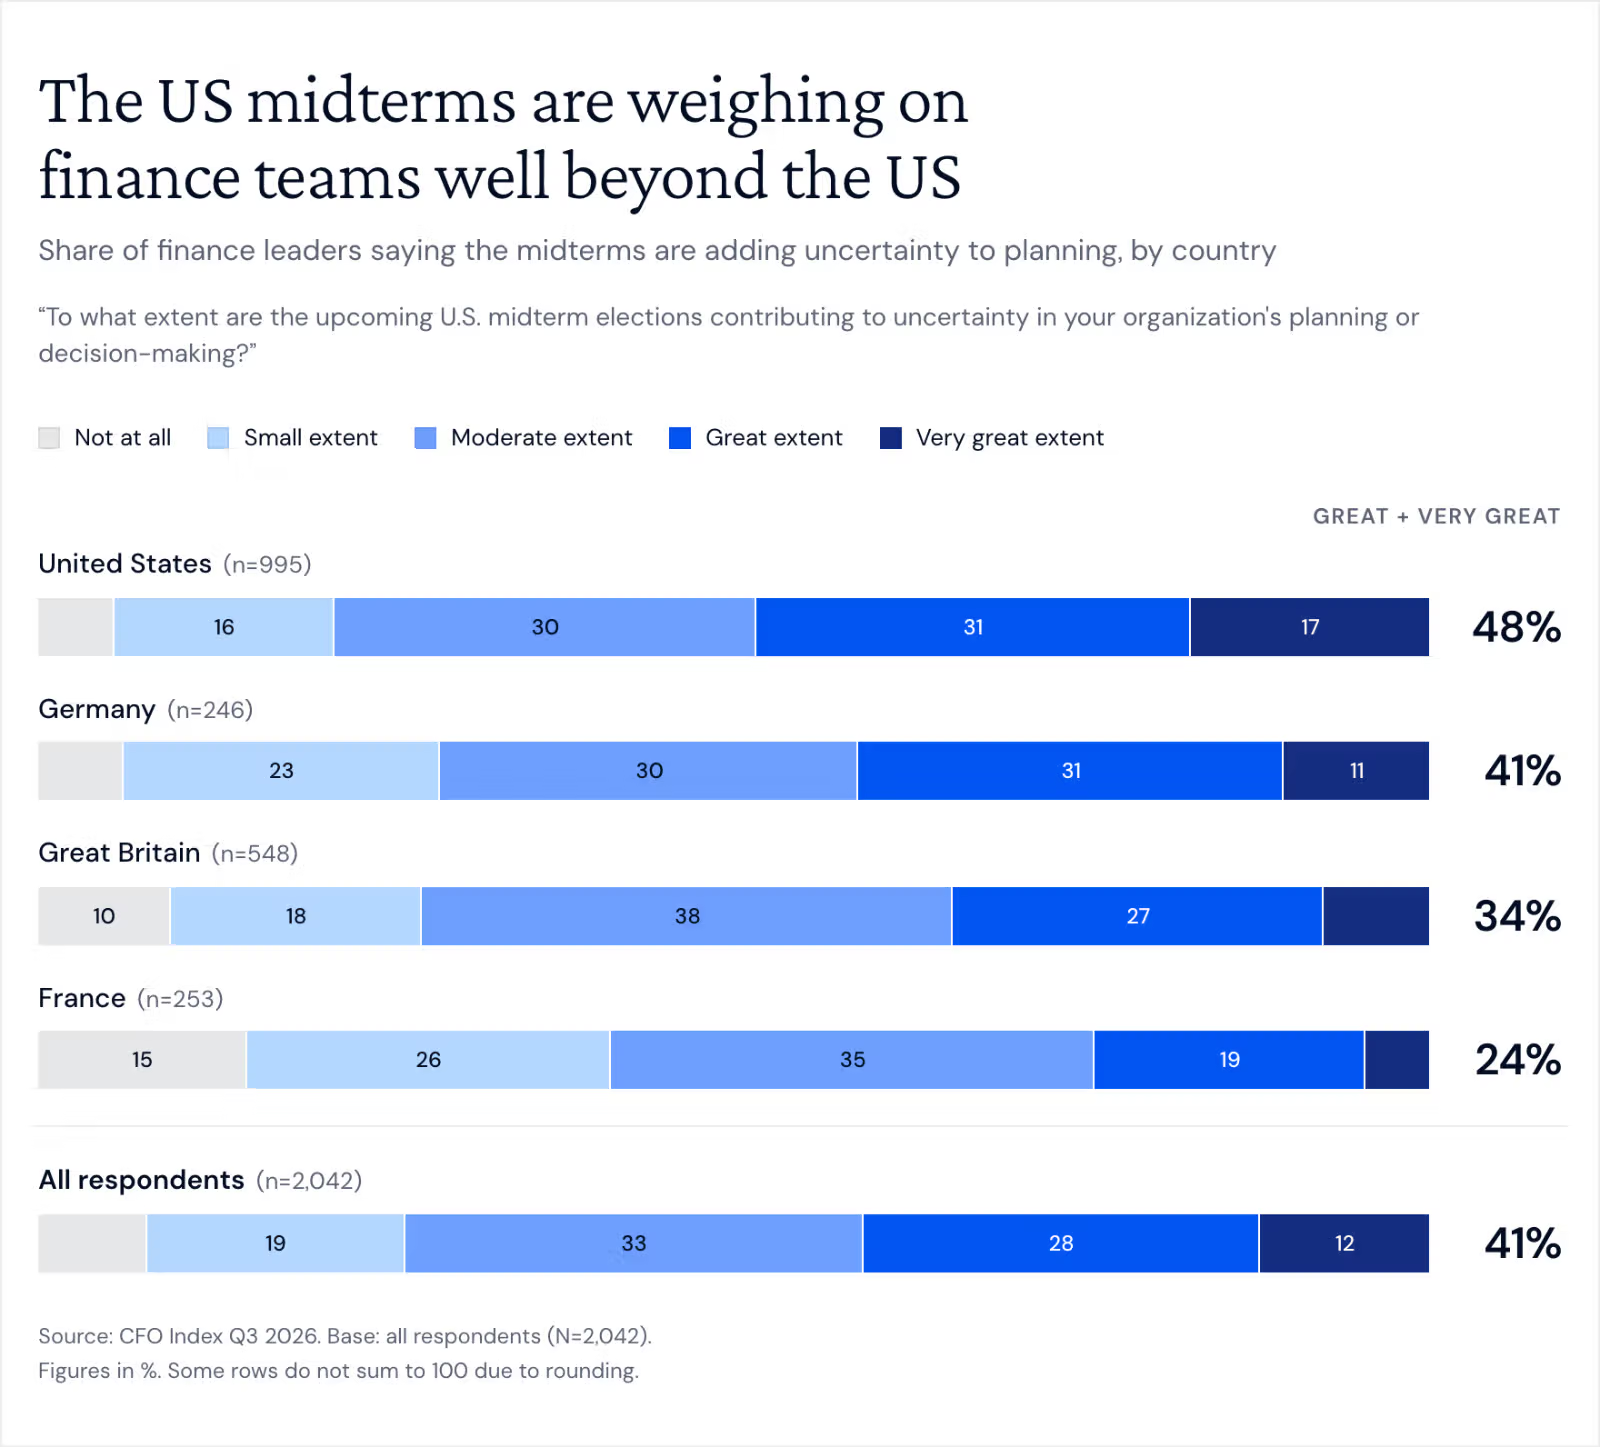
Meanwhile, the US midterms are a big concern for finance teams globally.
Of course it’s most intense in the US (48% say it’s fuelling uncertainty in their planning to a great/very great extent), but in Germany that number is 41%, 34% in the UK, and 24% in France.
And the French 2027 election is already weighing on plans. Of French respondents, 40% say it adds uncertainty to a great extent or more, rising to 54% among VP/CFOs.
Is AI out of control?
Most now have AI governance in place
The majority of firms say they control their AI tools centrally.
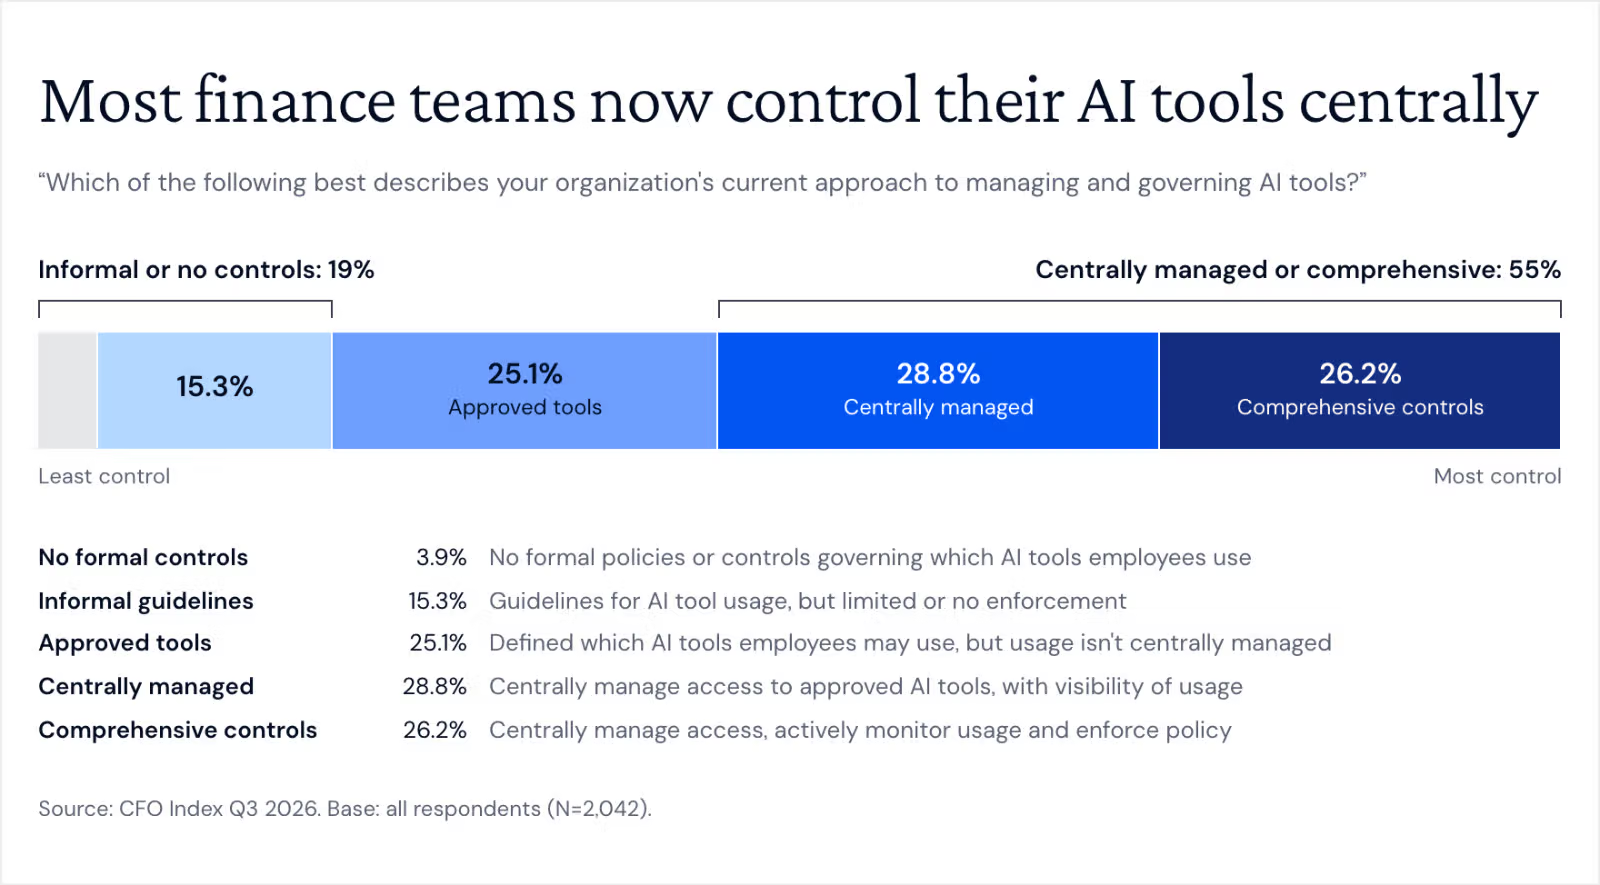
Over half (55%) maintain either centrally managed (29%) or comprehensive (26%) controls. A quarter (25%) have defined approved tools, and 19% have only informal guidelines or no controls.
But a familiar trend from past quarters is playing out in the data again: leaders and managers see governance very differently.
Of VP/CFOs, 66% describe centrally managed or comprehensive controls, against 45% of managers. A quarter of managers (25%) say governance is informal or non-existent.
Looking for a way to understand your spend? Read about Pigment’s AI Investment Planner here.
It seems that the policies enacted by senior management may not be penetrating through organizations properly yet. That’s a serious problem, because…
Everyone is overspending, badly
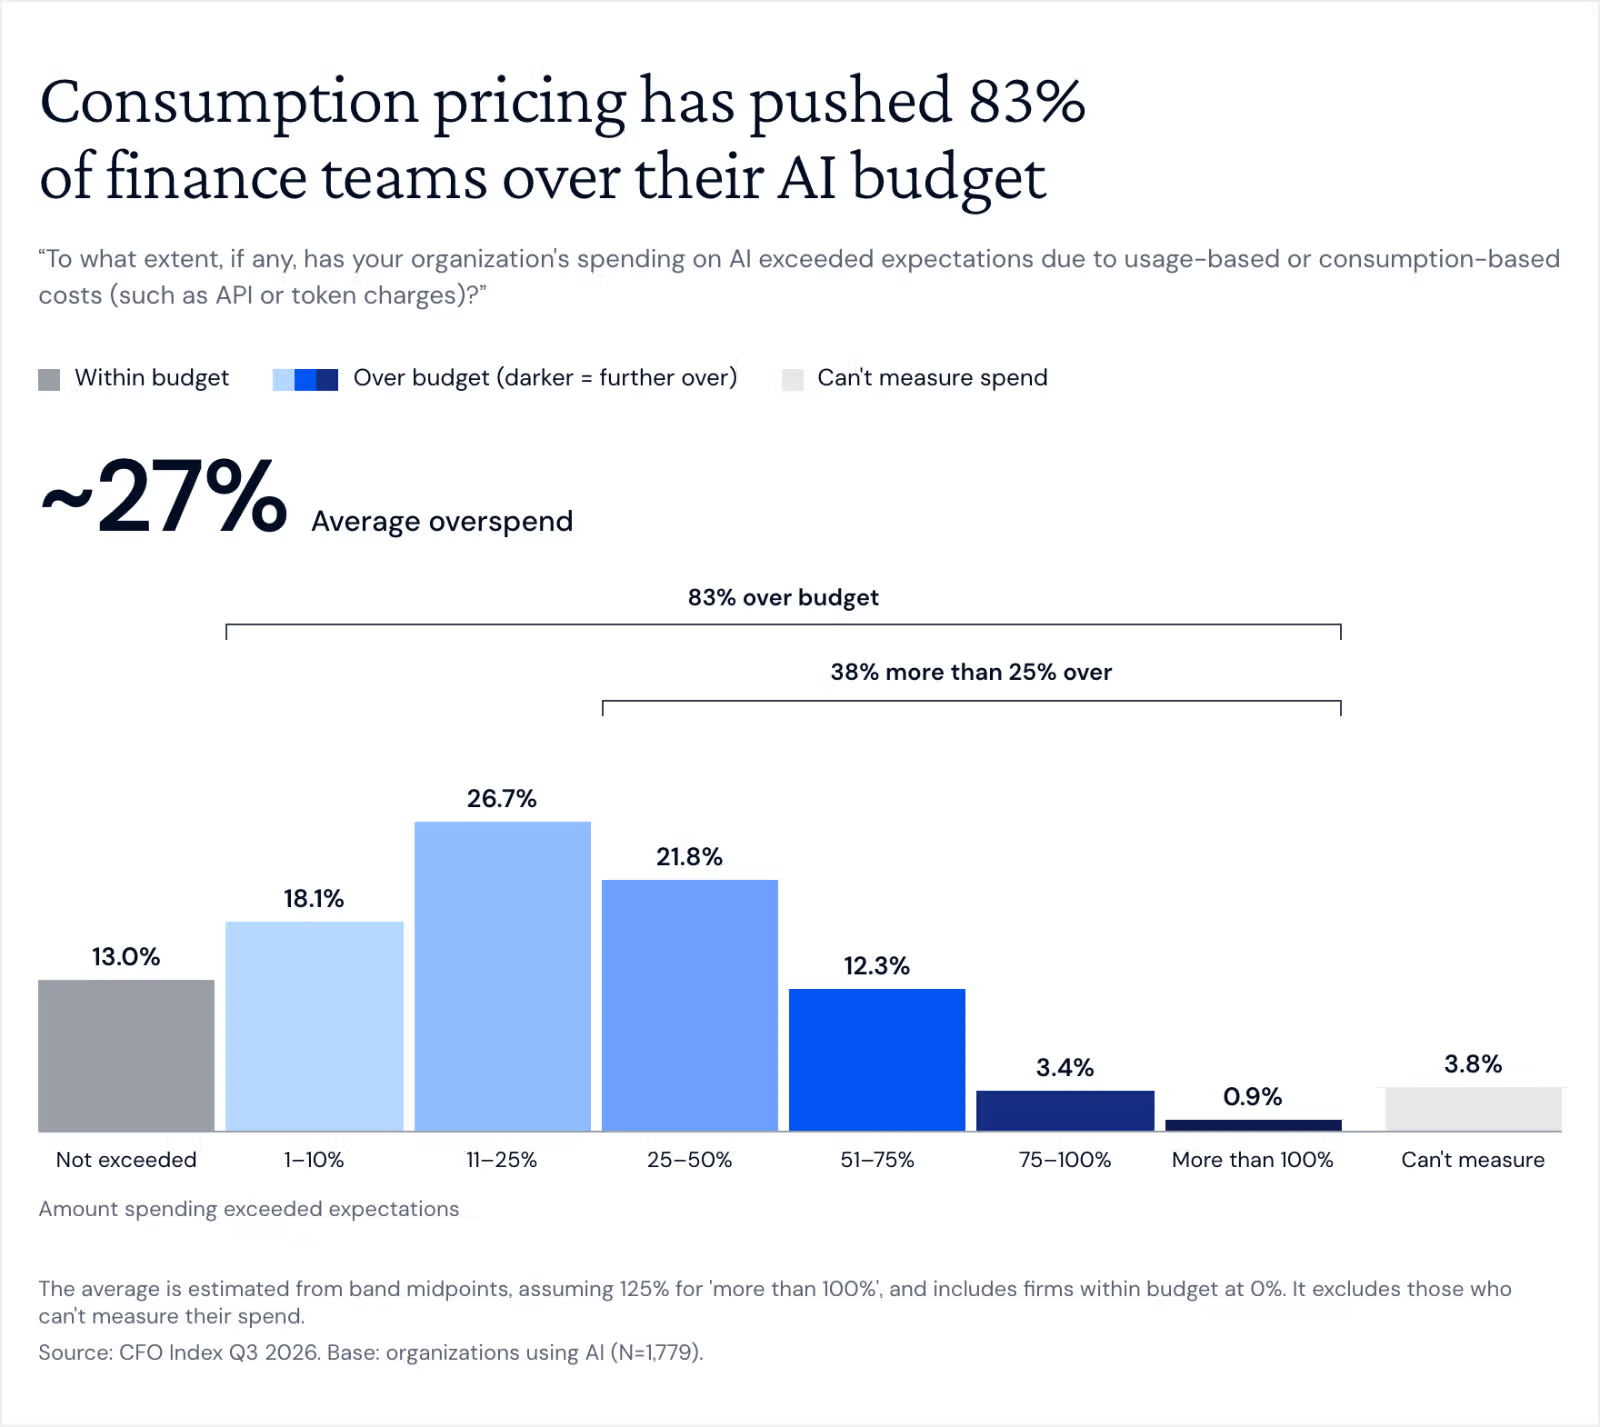
83% say consumption-based costs have pushed spending above expectations. Only 13% have stayed within budget, and 4% can't measure their spend at all. The median overrun is 11–25%.
However, 38% are more than 25% over and 17% are more than 50% over, which brings the average to around 27%.
We’re seeing the impact of this in the AI investment numbers: the expected increase in budgets for the next year dropped from 19.1% to 15.6%, the lowest yet. Crucially, that’s lower than the average overspend this year - a clear sign AI spending growth has peaked.
But they still think it’s worth it
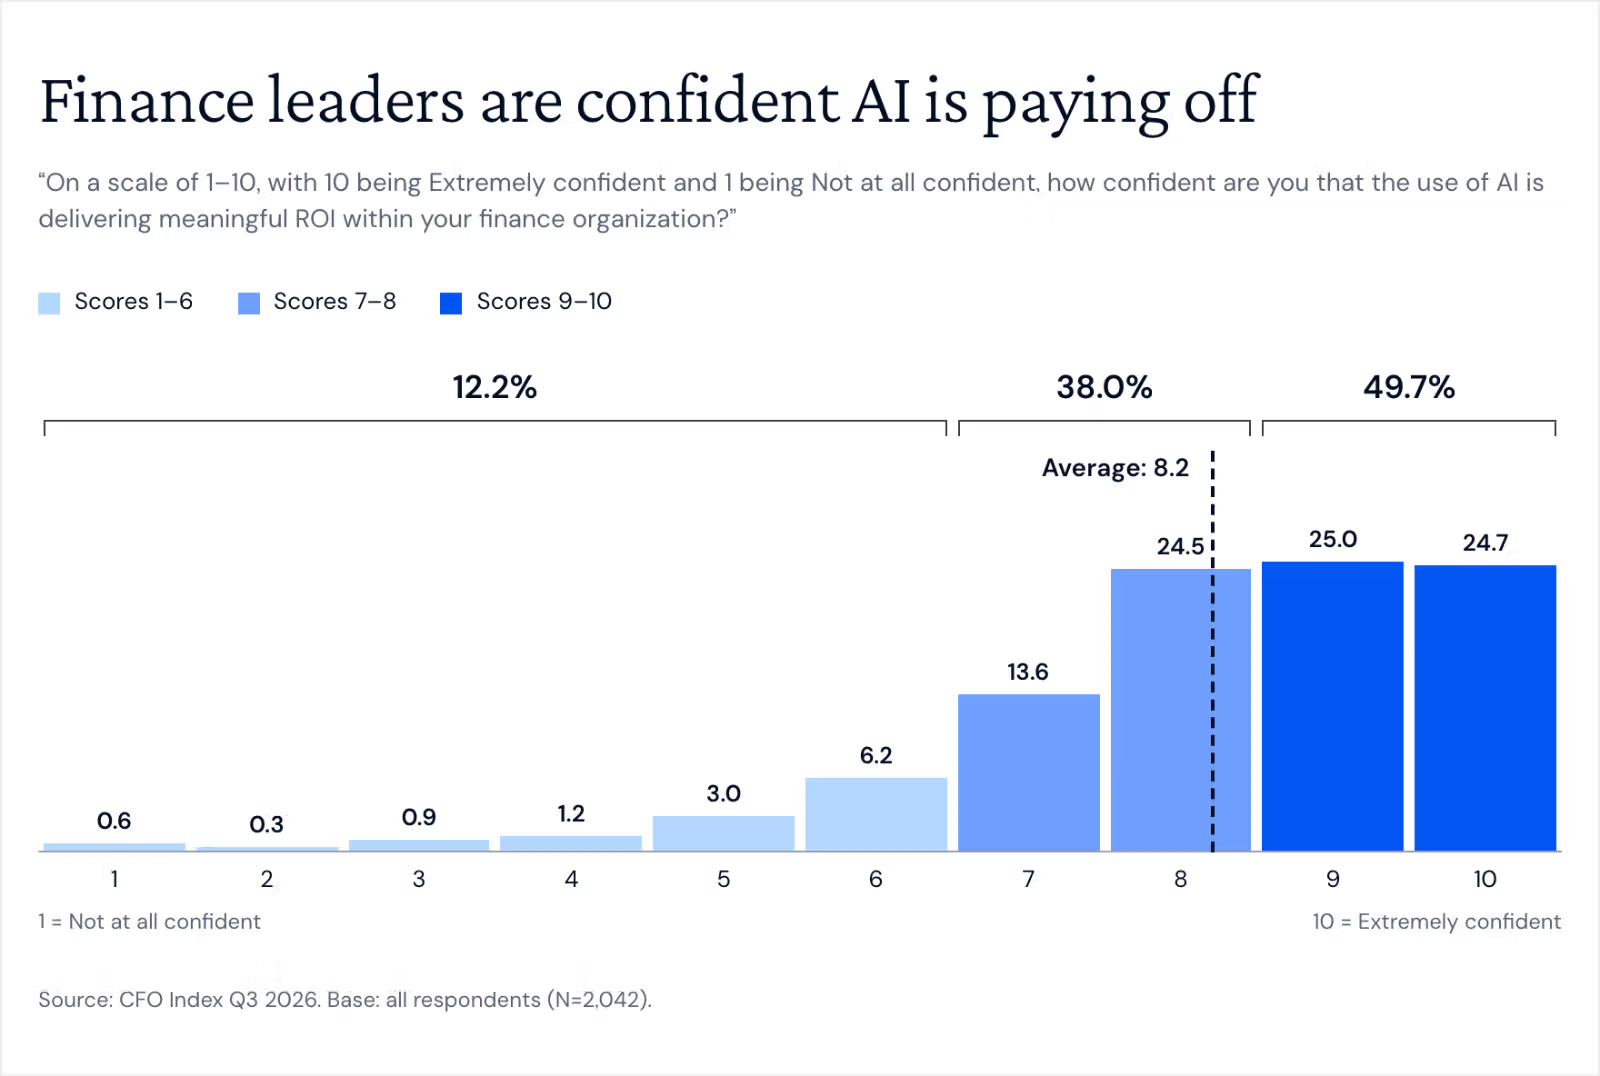
Confidence in the ROI of AI is high overall. The average score is 8.2 out of 10, with 50% scoring 9–10 and only 12% scoring 6 or below. This is a little bit odd because ‘unclear ROI’ is a growing barrier across quarters.
Benefits and barriers
The benefits being derived from AI in finance teams are, once again, shifting. Greater productivity and efficiency is still the largest perceived benefit, but it’s down 5 points this quarter.
Reduced manual work, which one might expect to be one of the largest benefits, has declined every quarter so far.
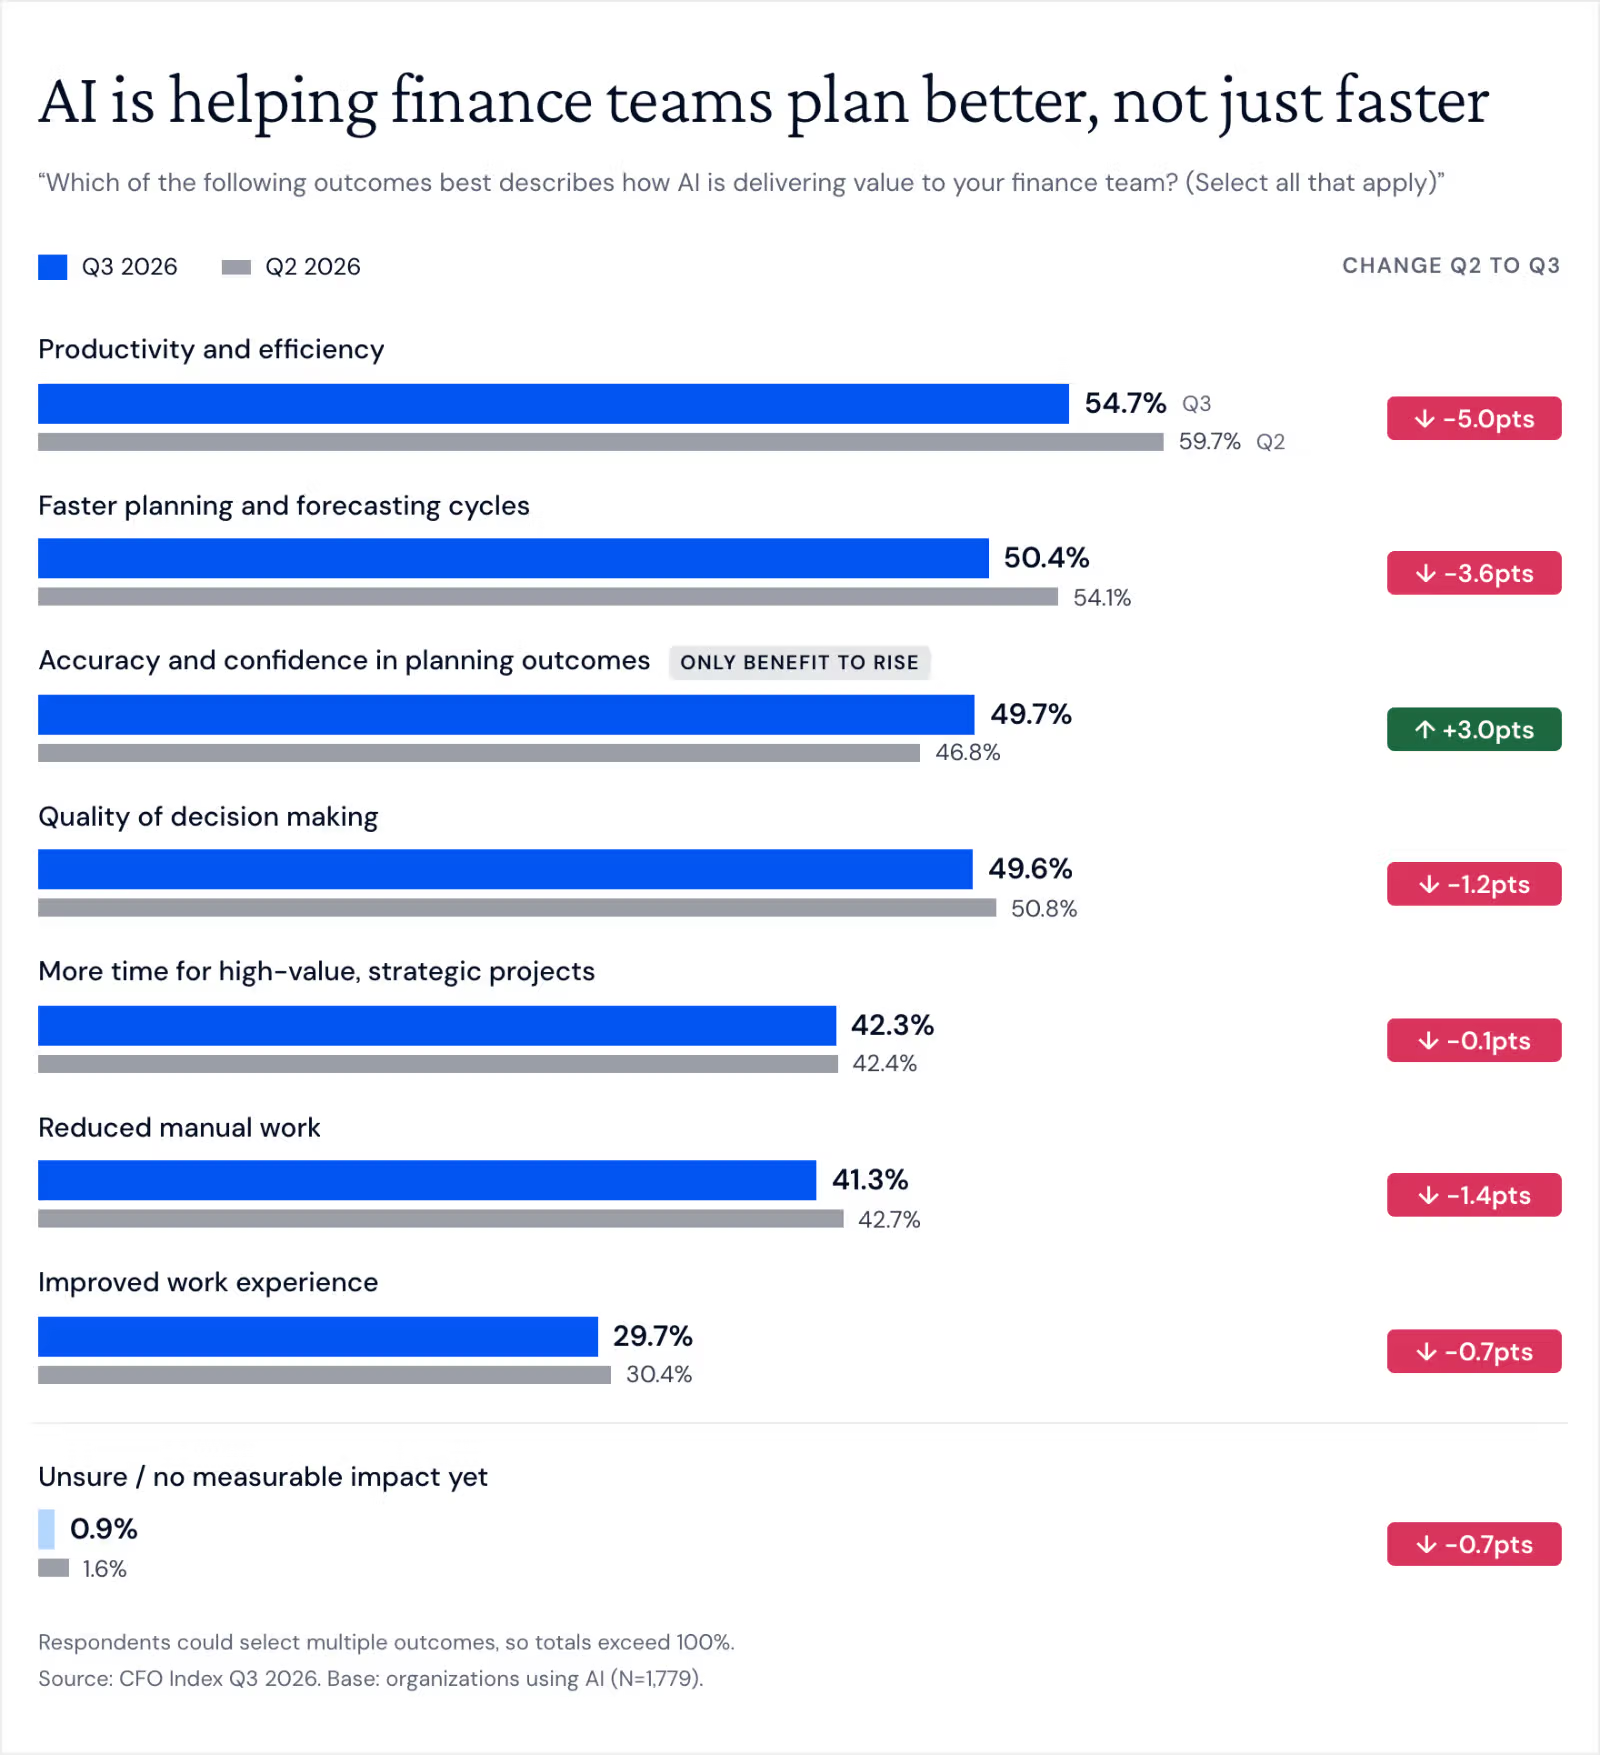
But accuracy and confidence in planning outcomes have risen QoQ, now drawing almost level with productivity and efficiency - as workflows become more optimized and engrained, teams are able to plan better rather than just faster.
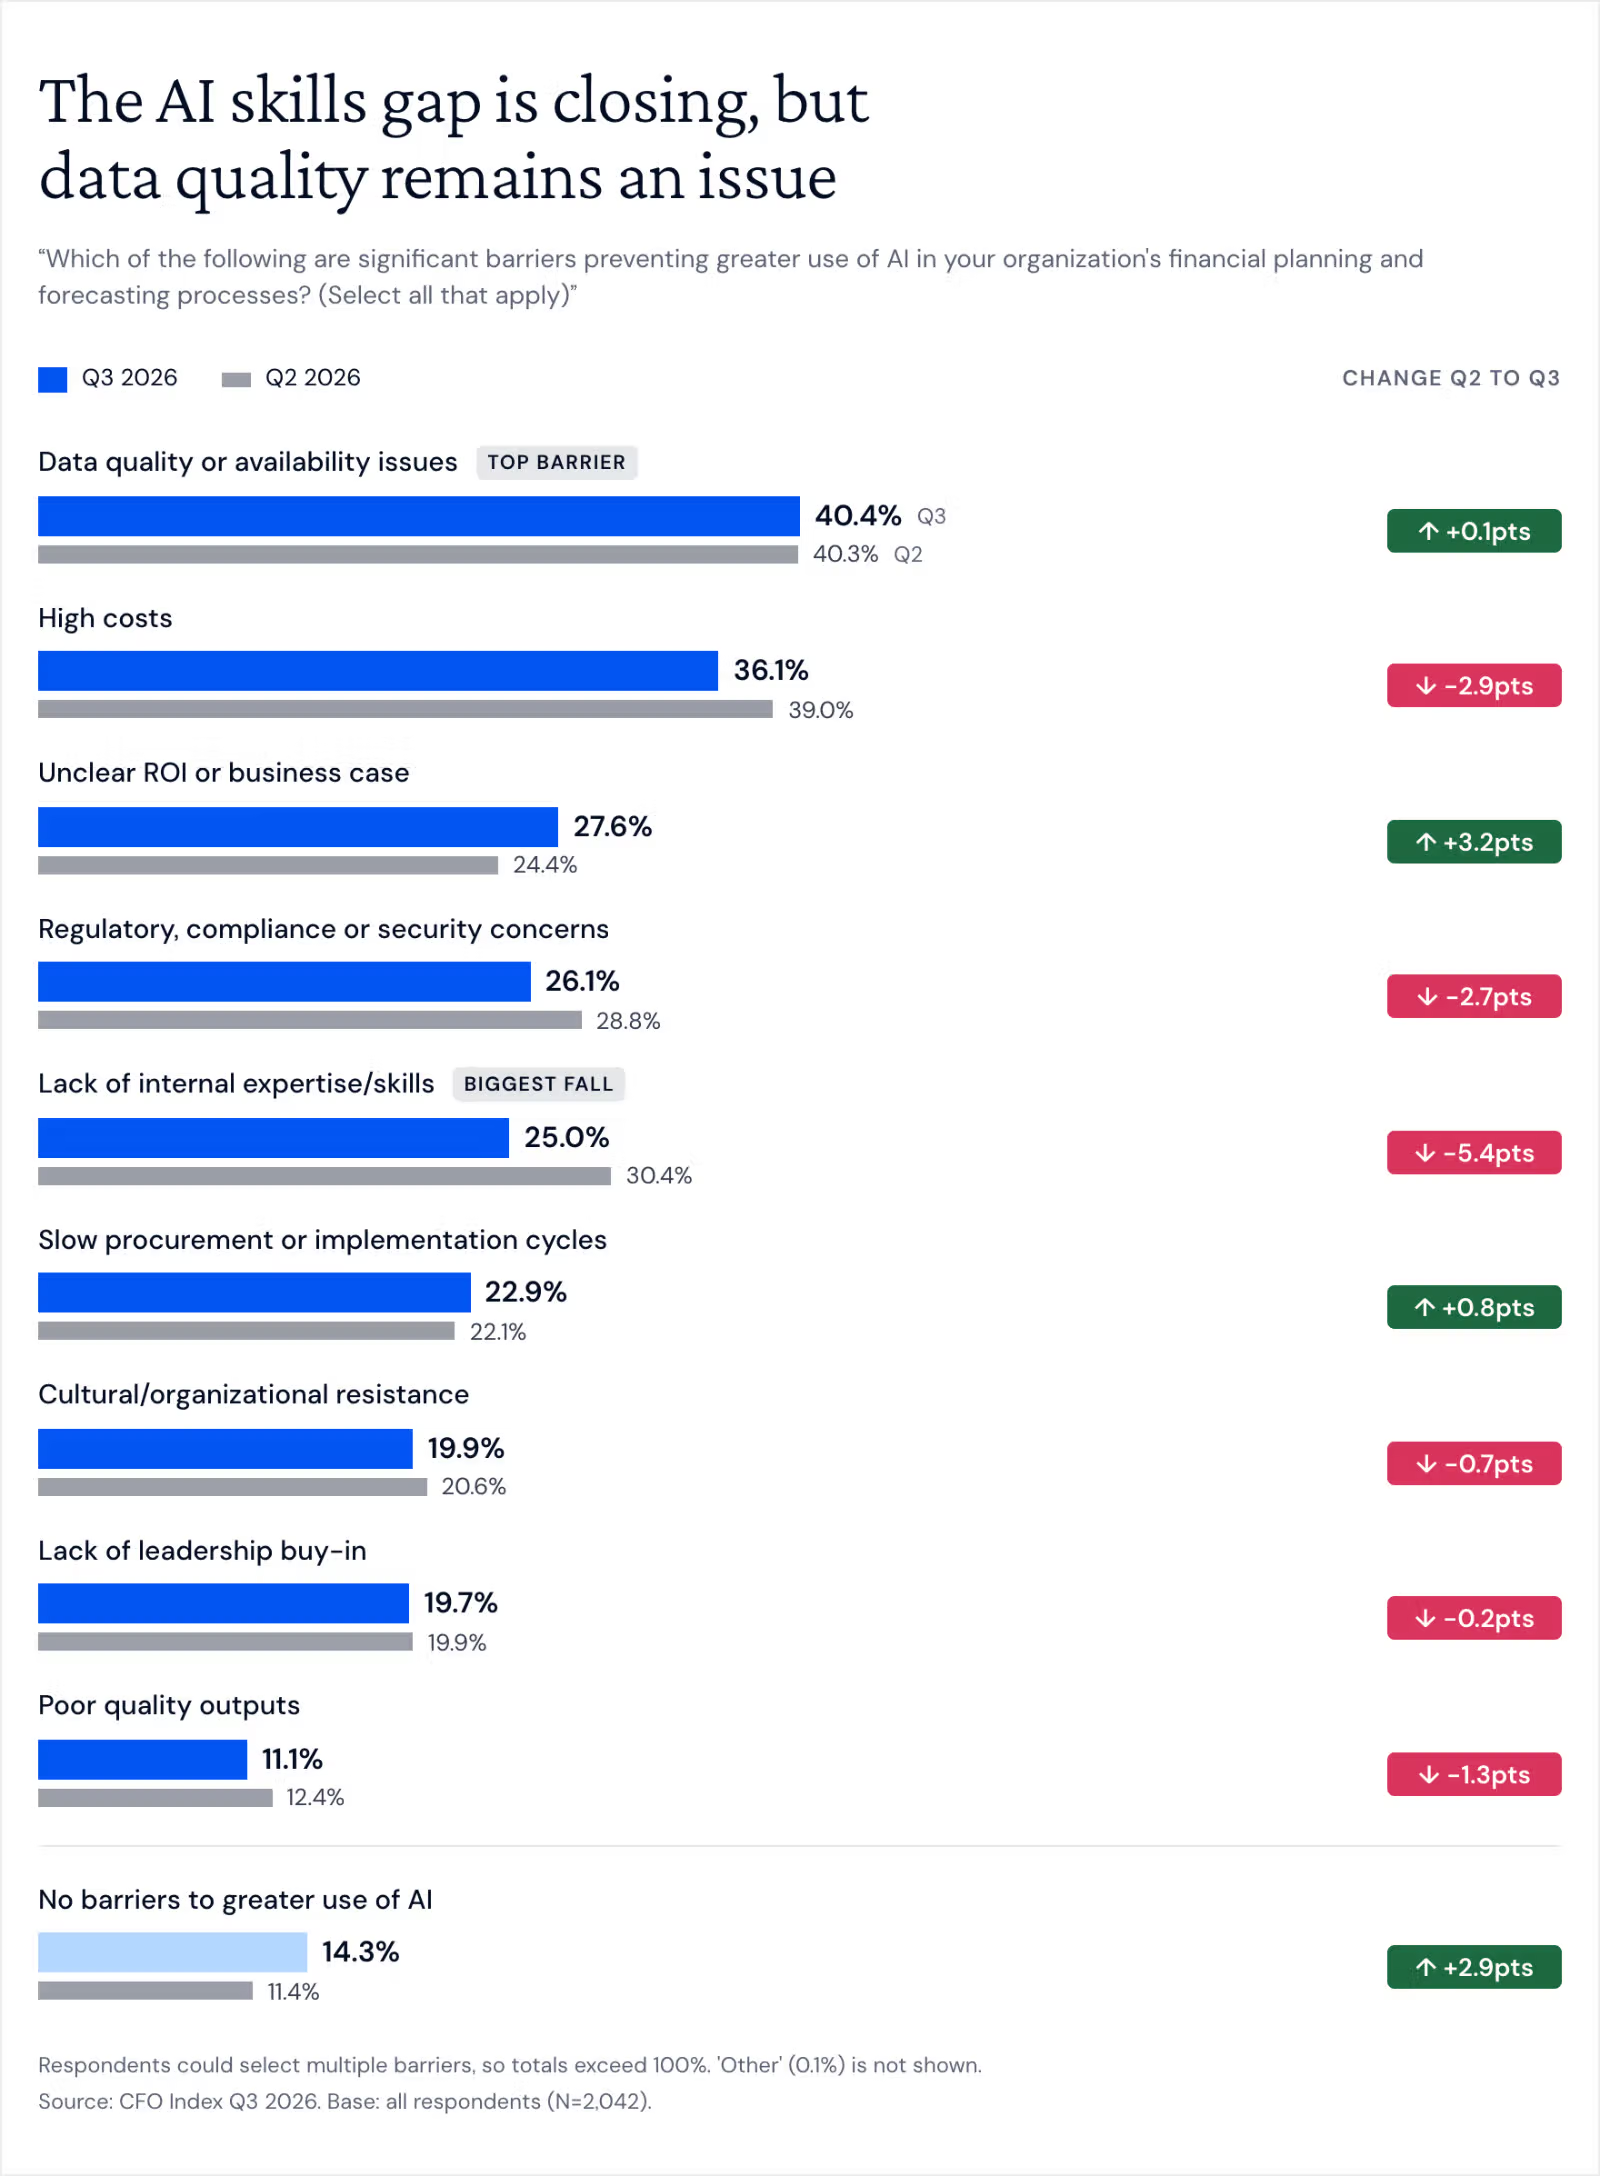
Looking at the barriers, we can see that the skills gap is closing, but data quality remains a sticky issue.
Learn how to improve your data quality posture in our playbook, Operationalizing AI in finance.
Cost is a smaller barrier than you'd expect given how many firms are over budget. Only 36% cite high costs as a barrier, down three points, even though 83% of AI users are over budget. But this does make sense intuitively - dramatic overspending clearly hasn’t been curtailed to this point, so it’s unlikely to show up as a barrier for finance teams looking to derive value from it.
As governance policies tighten, it’s likely we’ll see that number increase.
Impact on the office of finance
Where AI is exceeding expectations
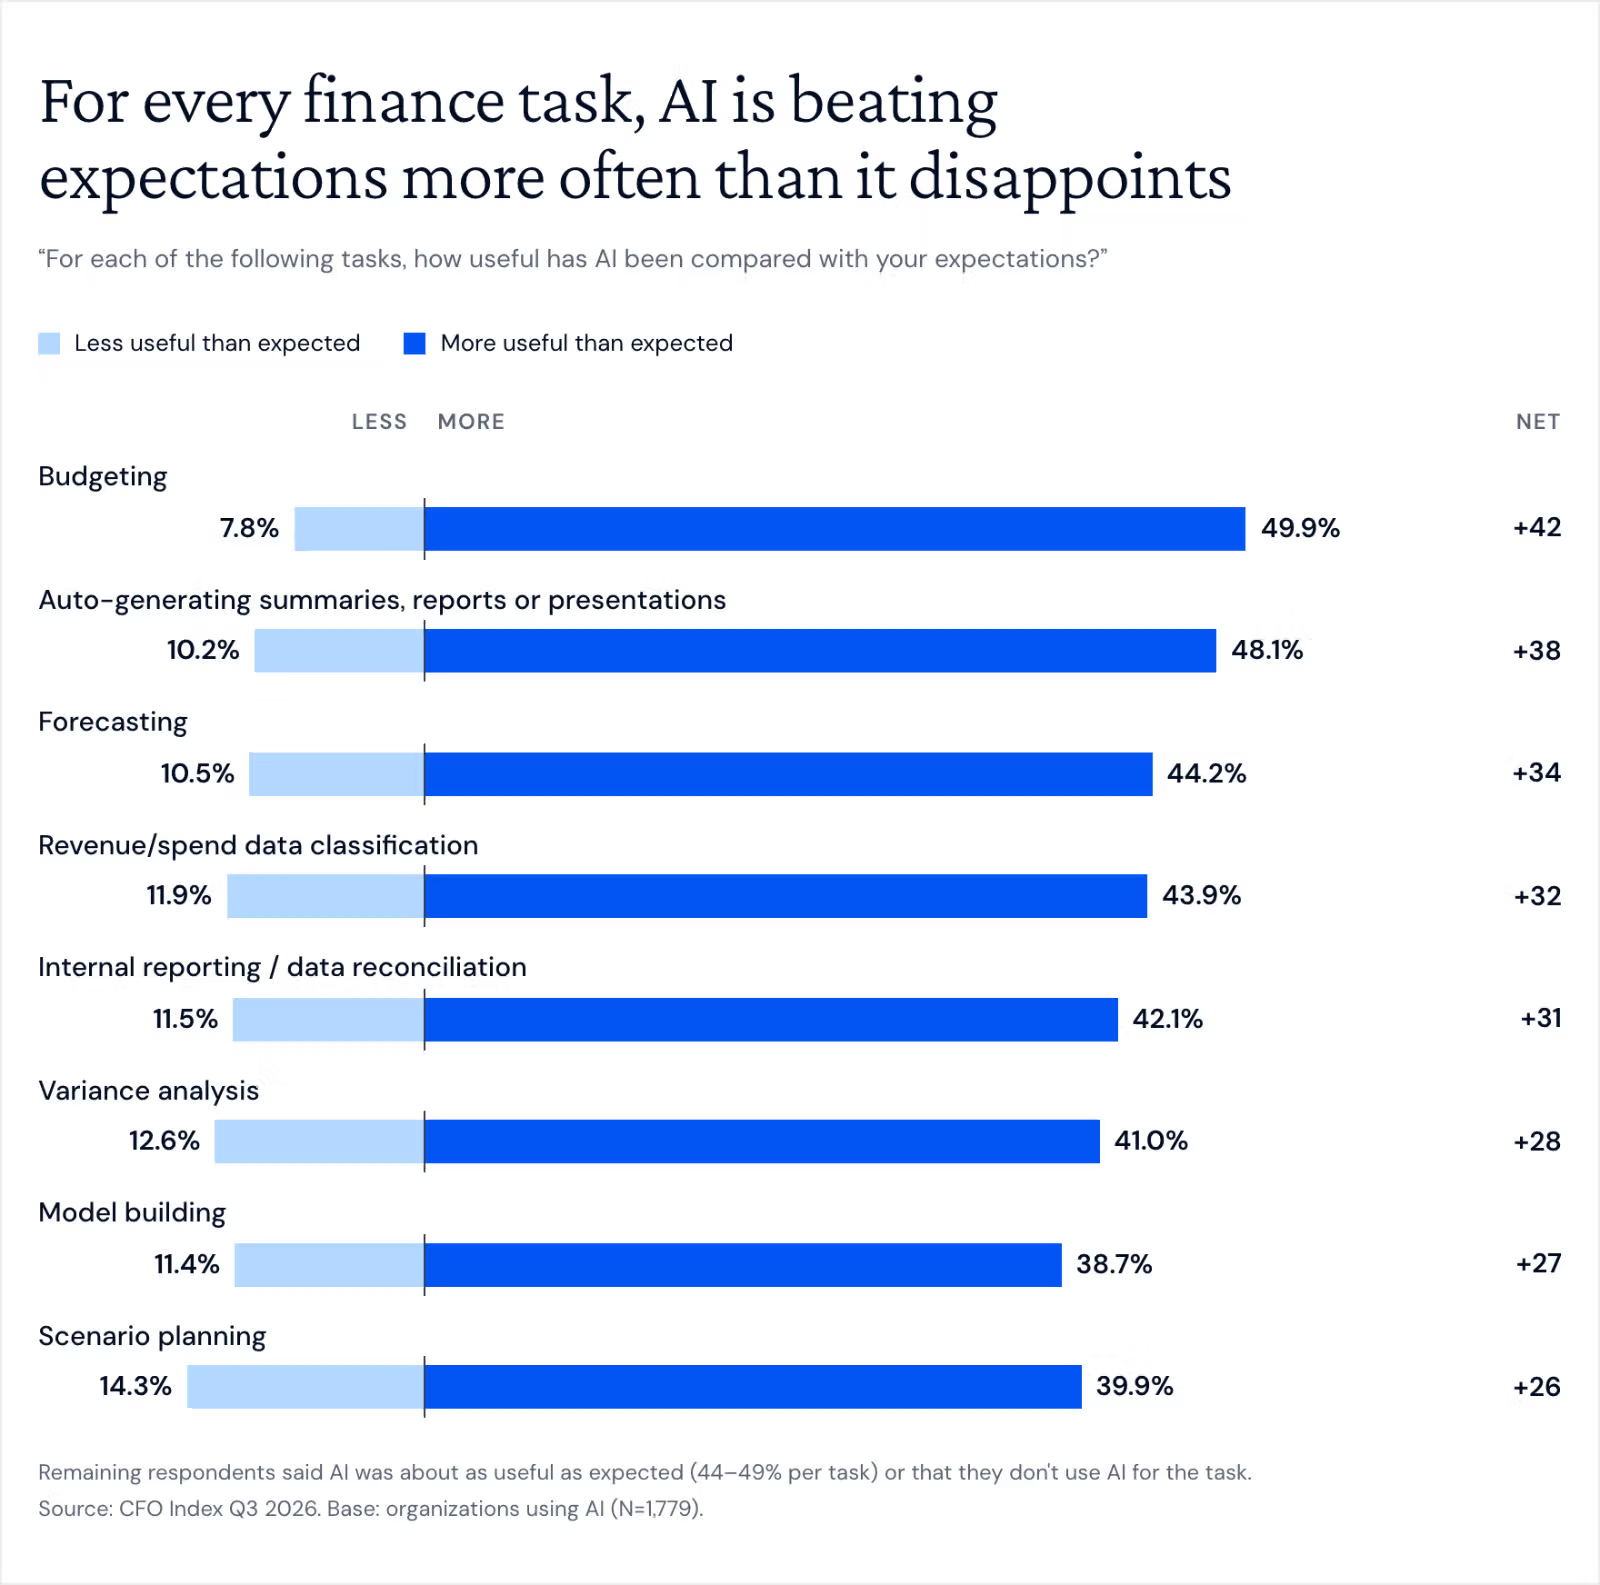
Respondents are incredibly bullish on AI. For every task we asked about, more respondents said AI was ‘more useful’ than expected than said it was ‘less useful’.
Unsurprisingly, AI is least successful for the tasks that demand human judgement: scenario planning and model building, for example.
Reshaping rather than shrinking
More firms say AI has increased their finance headcount (32%) than reduced it (20%). The most common change is to the work itself: 36% have changed the scope of existing roles, and 28% have created new finance roles. Only 12% say AI hasn't yet led to significant changes.
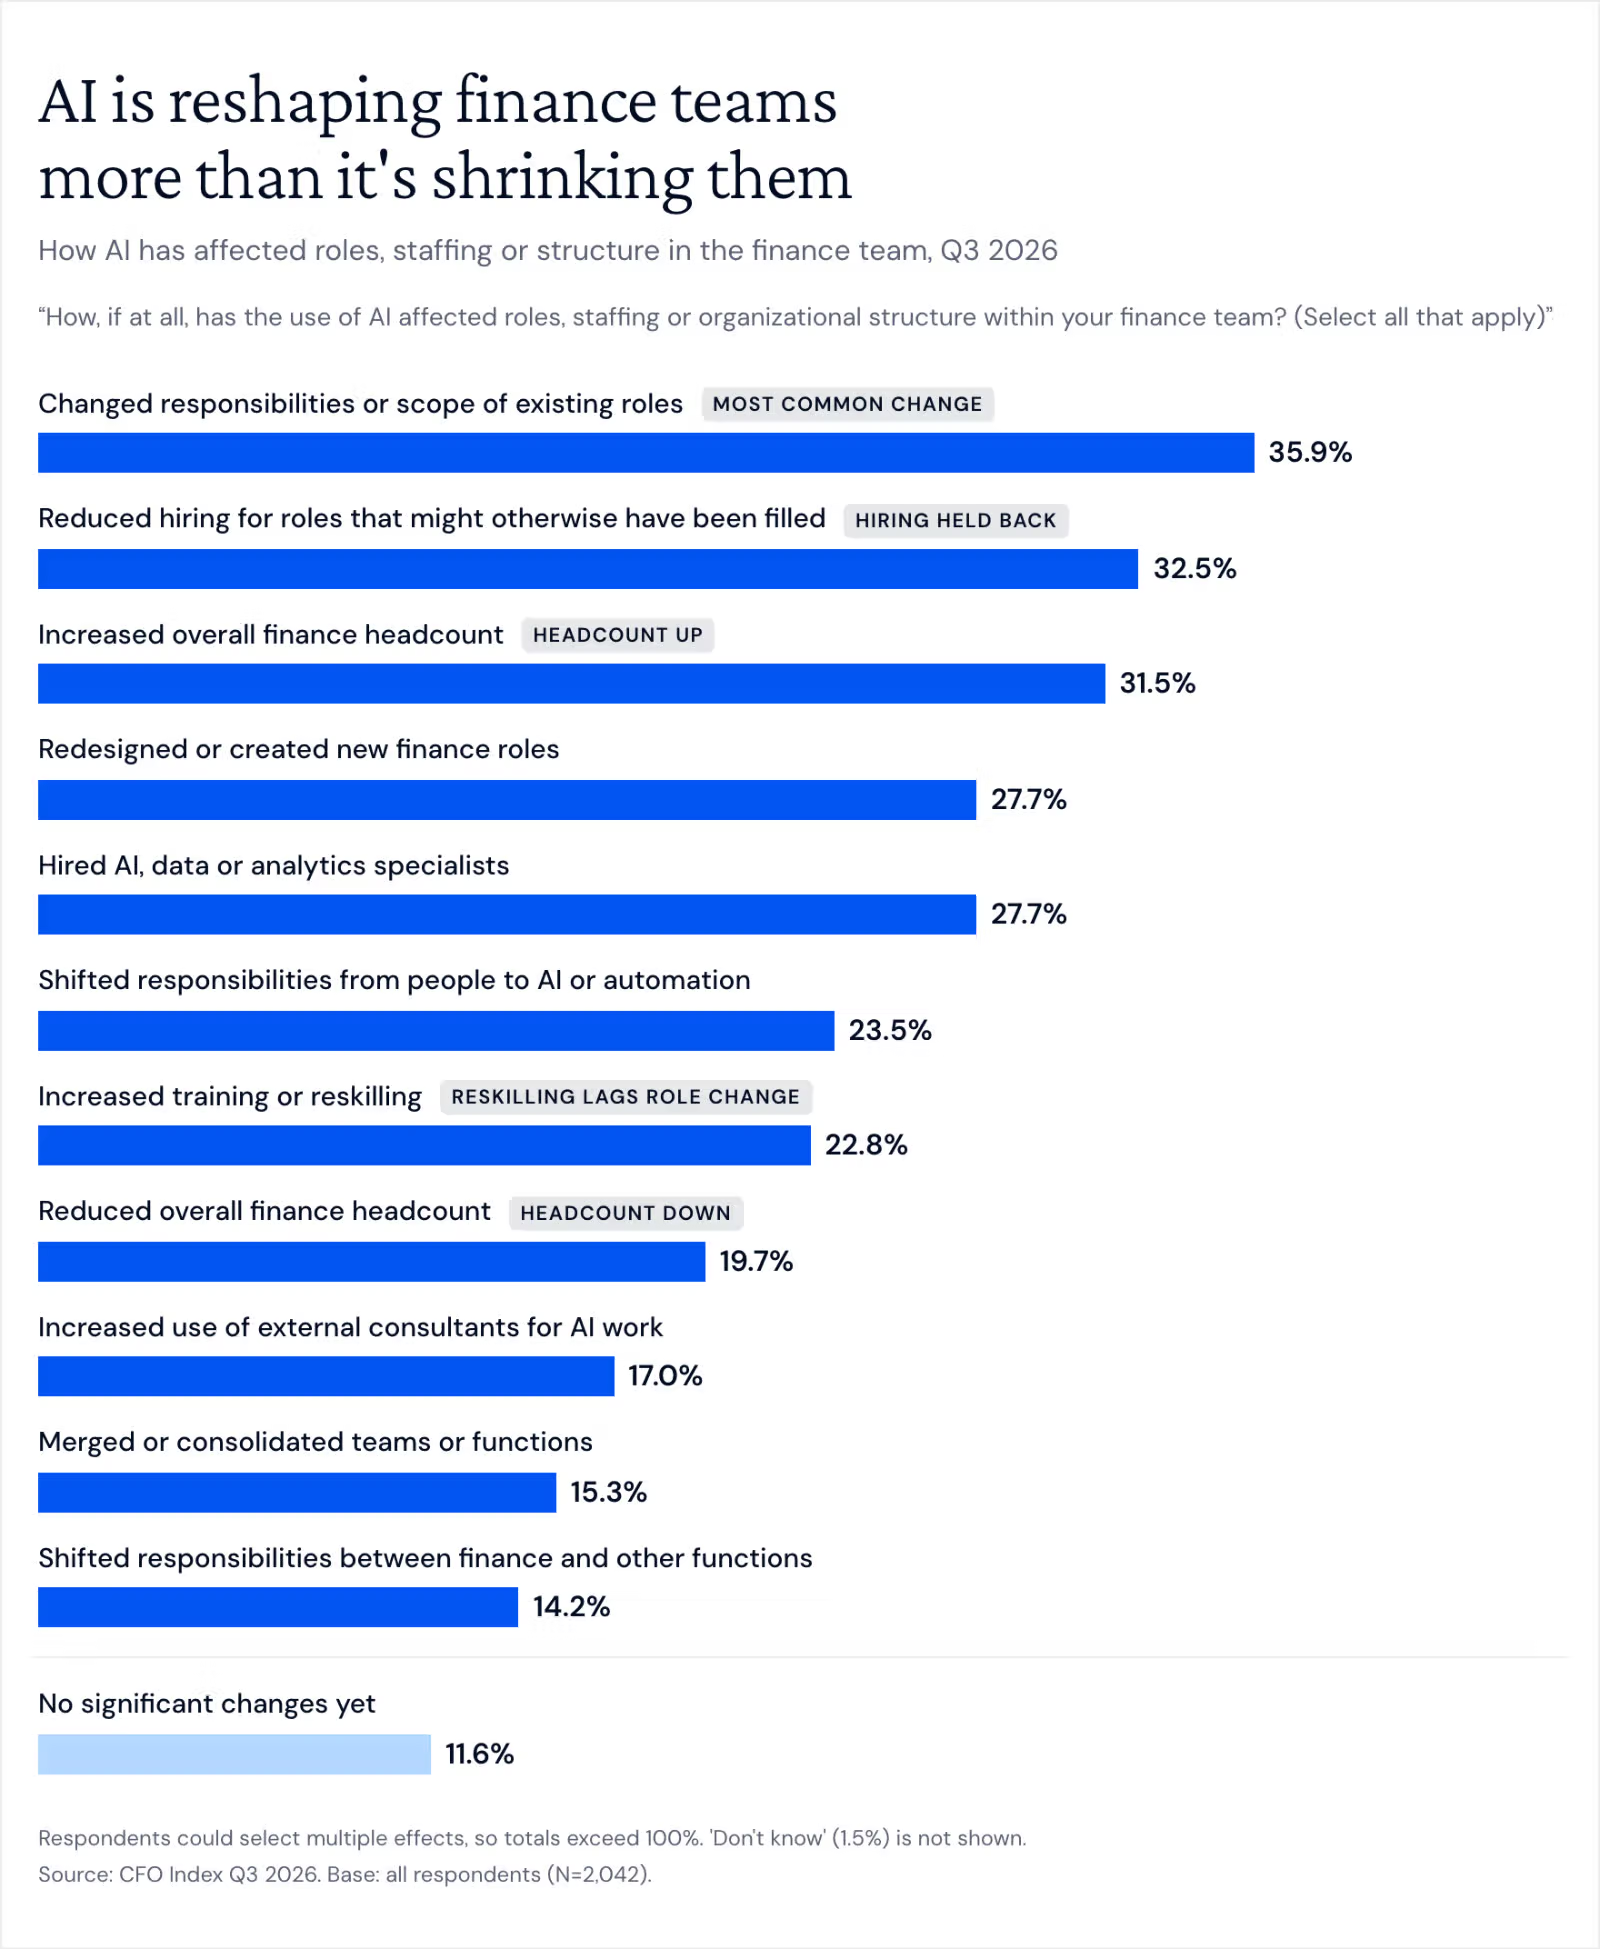
But a third of firms (33%) have reduced hiring for roles AI can now cover, and that figure is between 30% and 35% in almost every country, company size and seniority level we looked at. AI isn't cutting many existing finance jobs, but it's reducing the number of new ones - the entry-level roles, where future finance leaders get their start.
There's also a gap in reskilling. More than a third of firms have changed what their finance staff is responsible for, but fewer than a quarter have increased training.
The executive reporting burden
Finance teams spend a lot of time producing reports for leadership. The largest group (39%) spends 21–40 hours a month preparing dashboards and reports for executives, and one in five (21%) spends more than 40 hours.
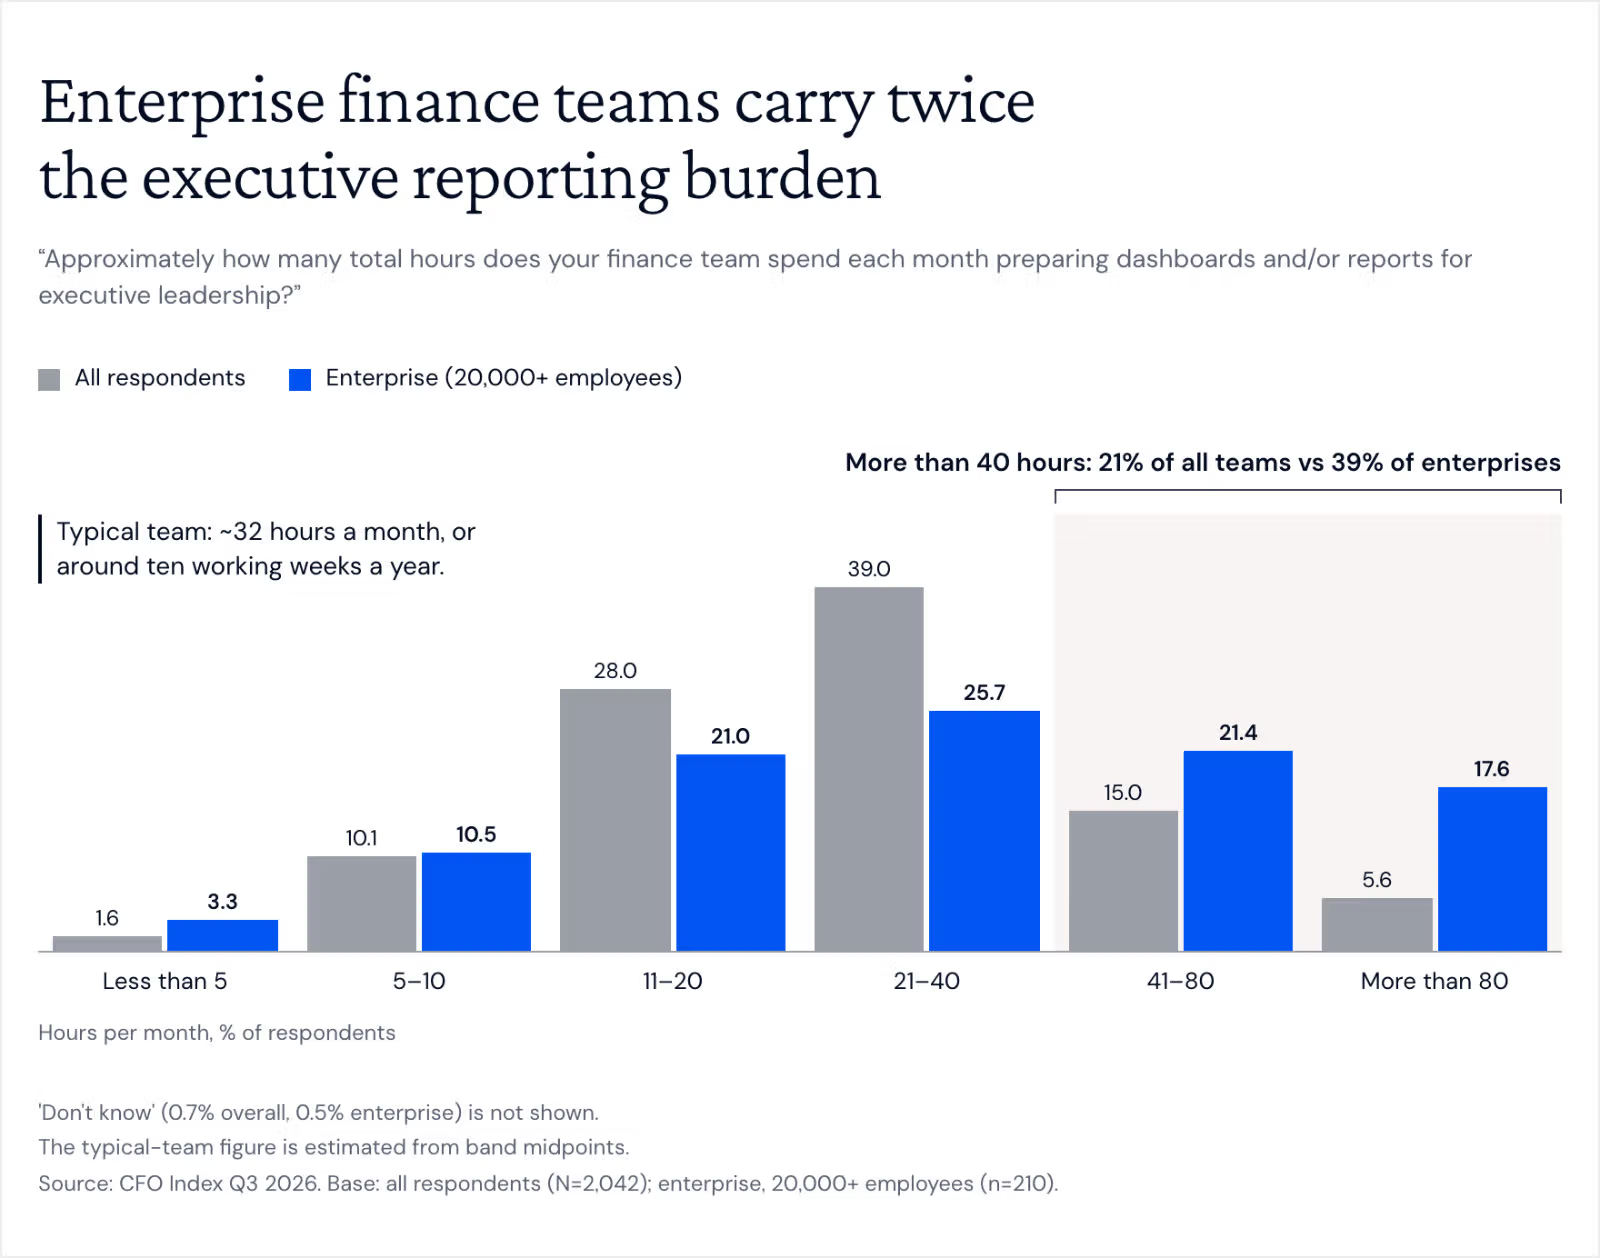
That works out to roughly 32 hours a month for the typical team, or around ten working weeks a year. At the enterprise level, it’s an even bleaker picture: 39% spend more than 40 hours a month, and 18% spend more than 80.
Most surprising, AI doesn’t seem to be reducing it. Automatically generating reports and summaries is one of the tasks where AI has most exceeded expectations (48% say it's more useful than expected).
But 30% of the most AI-mature firms spend more than 40 hours a month on executive reporting, compared with 17% of early-stage firms. Perhaps when reports become quicker to produce, leadership asks for more of them.
If only there was a way to instantly generate reports for leadership… Read up on Pigment Frames here.
Join us to discuss the findings
Too much to take in at once?
Pigment’s incoming CFO, Susan Phan, will be hosting a webinar with John Van Decker from Dresner Advisory Services, to discuss the findings, what they mean for you, and how they should inform your plans.